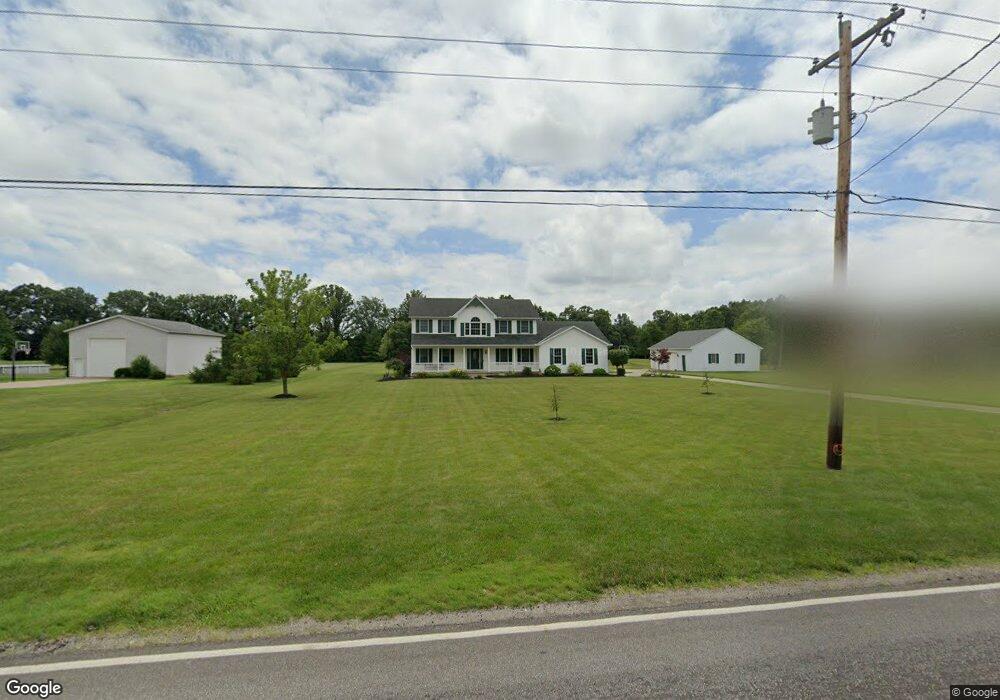
41157 Parsons Rd Lagrange, OH 44050
Estimated Value: $472,293 - $573,000
3
Beds
3
Baths
2,700
Sq Ft
$194/Sq Ft
Est. Value
About This Home
This home is located at 41157 Parsons Rd, Lagrange, OH 44050 and is currently estimated at $522,573, approximately $193 per square foot. 41157 Parsons Rd is a home located in Lorain County with nearby schools including Keystone Elementary School, Keystone Middle School, and Keystone High School.
Ownership History
Date
Name
Owned For
Owner Type
Purchase Details
Closed on
Jul 14, 2009
Sold by
Roberts Lynda S
Bought by
Bumgardner Robert J
Current Estimated Value
Home Financials for this Owner
Home Financials are based on the most recent Mortgage that was taken out on this home.
Original Mortgage
$260,200
Outstanding Balance
$169,909
Interest Rate
5.32%
Mortgage Type
FHA
Estimated Equity
$352,664
Purchase Details
Closed on
Jul 28, 2005
Sold by
Roberts Thomas E
Bought by
Roberts Lynda S
Purchase Details
Closed on
Sep 8, 2004
Sold by
Shullick Michael A and Shullick Cynthia L
Bought by
Roberts Thomas E
Home Financials for this Owner
Home Financials are based on the most recent Mortgage that was taken out on this home.
Original Mortgage
$150,000
Interest Rate
6.17%
Mortgage Type
New Conventional
Purchase Details
Closed on
Jul 1, 1998
Sold by
David Development Inc
Bought by
Shullick Michael A and Shullick Cynthia L
Purchase Details
Closed on
Apr 10, 1998
Sold by
David Development Inc
Bought by
David Development Inc
Create a Home Valuation Report for This Property
The Home Valuation Report is an in-depth analysis detailing your home's value as well as a comparison with similar homes in the area
Home Values in the Area
Average Home Value in this Area
Purchase History
| Date | Buyer | Sale Price | Title Company |
|---|---|---|---|
| Bumgardner Robert J | $265,000 | Attorney | |
| Roberts Lynda S | -- | Multiple | |
| Roberts Thomas E | $297,000 | Hometown Usa Title Agency Lt | |
| Shullick Michael A | $42,900 | Lorain County Title Co Inc | |
| David Development Inc | -- | -- |
Source: Public Records
Mortgage History
| Date | Status | Borrower | Loan Amount |
|---|---|---|---|
| Open | Bumgardner Robert J | $260,200 | |
| Previous Owner | Roberts Thomas E | $150,000 |
Source: Public Records
Tax History
| Year | Tax Paid | Tax Assessment Tax Assessment Total Assessment is a certain percentage of the fair market value that is determined by local assessors to be the total taxable value of land and additions on the property. | Land | Improvement |
|---|---|---|---|---|
| 2024 | $5,340 | $130,575 | $24,189 | $106,386 |
| 2023 | $5,693 | $116,589 | $23,594 | $92,995 |
| 2022 | $5,651 | $116,589 | $23,594 | $92,995 |
| 2021 | $5,653 | $116,589 | $23,594 | $92,995 |
| 2020 | $4,998 | $91,870 | $18,590 | $73,280 |
| 2019 | $4,967 | $91,870 | $18,590 | $73,280 |
| 2018 | $4,845 | $91,870 | $18,590 | $73,280 |
| 2017 | $4,718 | $83,800 | $19,500 | $64,300 |
| 2016 | $4,685 | $83,800 | $19,500 | $64,300 |
| 2015 | $4,677 | $83,800 | $19,500 | $64,300 |
| 2014 | $3,857 | $79,060 | $18,400 | $60,660 |
| 2013 | $3,737 | $79,060 | $18,400 | $60,660 |
Source: Public Records
Map
Nearby Homes
- 40175 Banks Rd
- 40163 Banks Rd
- 829 Robinson Dr
- 340 Granger Dr
- 41341 Ravines Edge Way
- 808 Buckingham Dr
- 800 Buckingham Dr
- 801 Willich Ct
- 567 Vicksburg Ct
- 548 William St
- 516 Appomattox Ct
- 317 Church St
- 13301 Indian Hollow Rd
- 305 W Main St
- 0 Dill Ct Unit 5072837
- 110 Railroad St
- 1033 Parsons Rd Unit 11
- 1207 Fox Run
- 43915 State Route 511
- 1167 Fox Run
- 41115 Parsons Rd
- 41199 Parsons Rd
- 41250 Parsons Rd
- 41073 Parsons Rd
- 41021 Parsons Rd
- 41293 Parsons Rd
- 41366 Parsons Rd
- 41038 Parsons Rd
- 40973 Parsons Rd
- 41335 Parsons Rd
- 41248 Parsons Rd
- 41424 Parsons Rd
- 41032 Parsons Rd
- 41482 Parsons Rd
- 41500 Parsons Rd
- 41388 Parsons Rd
- 41028 Parsons Rd
- 41540 Parsons Rd
- VL C Parsons Rd
- VL E & F Parsons Rd
Your Personal Tour Guide
Ask me questions while you tour the home.