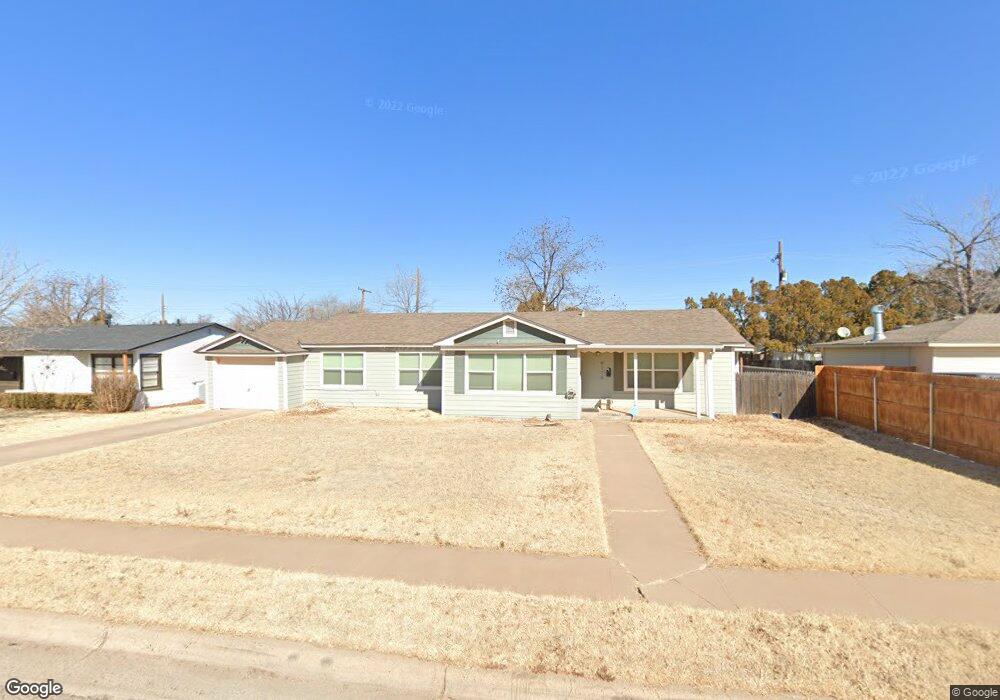
4116 33rd St Lubbock, TX 79410
Maxey Park NeighborhoodEstimated Value: $174,000 - $198,000
3
Beds
1
Bath
1,748
Sq Ft
$107/Sq Ft
Est. Value
About This Home
This home is located at 4116 33rd St, Lubbock, TX 79410 and is currently estimated at $186,584, approximately $106 per square foot. 4116 33rd St is a home located in Lubbock County with nearby schools including Overton Elementary School, Commander William C. McCool Academy, and Mackenzie Middle School.
Ownership History
Date
Name
Owned For
Owner Type
Purchase Details
Closed on
Mar 24, 2008
Sold by
Sutherland Kendra L
Bought by
Sutherland Jeffrey S
Current Estimated Value
Purchase Details
Closed on
Nov 20, 2007
Sold by
Sutherland Jeffrey S and Sutherland Kendra L
Bought by
Sutherland Jeffrey S
Purchase Details
Closed on
May 30, 2002
Sold by
Mitchell Lola P Trust
Bought by
Sutherland Jeffrey S
Create a Home Valuation Report for This Property
The Home Valuation Report is an in-depth analysis detailing your home's value as well as a comparison with similar homes in the area
Home Values in the Area
Average Home Value in this Area
Purchase History
| Date | Buyer | Sale Price | Title Company |
|---|---|---|---|
| Sutherland Jeffrey S | -- | None Available | |
| Sutherland Jeffrey S | -- | -- | |
| Sutherland Jeffrey S | -- | -- |
Source: Public Records
Mortgage History
| Date | Status | Borrower | Loan Amount |
|---|---|---|---|
| Closed | Sutherland Jeffrey S | $0 |
Source: Public Records
Tax History Compared to Growth
Tax History
| Year | Tax Paid | Tax Assessment Tax Assessment Total Assessment is a certain percentage of the fair market value that is determined by local assessors to be the total taxable value of land and additions on the property. | Land | Improvement |
|---|---|---|---|---|
| 2025 | $3,416 | $170,707 | $25,000 | $145,707 |
| 2024 | $3,416 | $188,108 | $25,000 | $163,108 |
| 2023 | $3,164 | $170,230 | $15,098 | $155,132 |
| 2022 | $3,343 | $165,158 | $15,098 | $150,060 |
| 2021 | $2,455 | $114,613 | $15,098 | $99,515 |
| 2020 | $2,464 | $113,293 | $15,098 | $98,195 |
| 2019 | $2,558 | $113,958 | $15,098 | $98,860 |
| 2018 | $2,473 | $110,000 | $15,098 | $94,902 |
| 2017 | $2,318 | $103,002 | $15,098 | $87,904 |
| 2016 | $2,251 | $100,002 | $15,098 | $84,904 |
| 2015 | $2,153 | $98,522 | $15,098 | $83,424 |
| 2014 | $2,153 | $96,807 | $7,425 | $89,382 |
Source: Public Records
Map
Nearby Homes