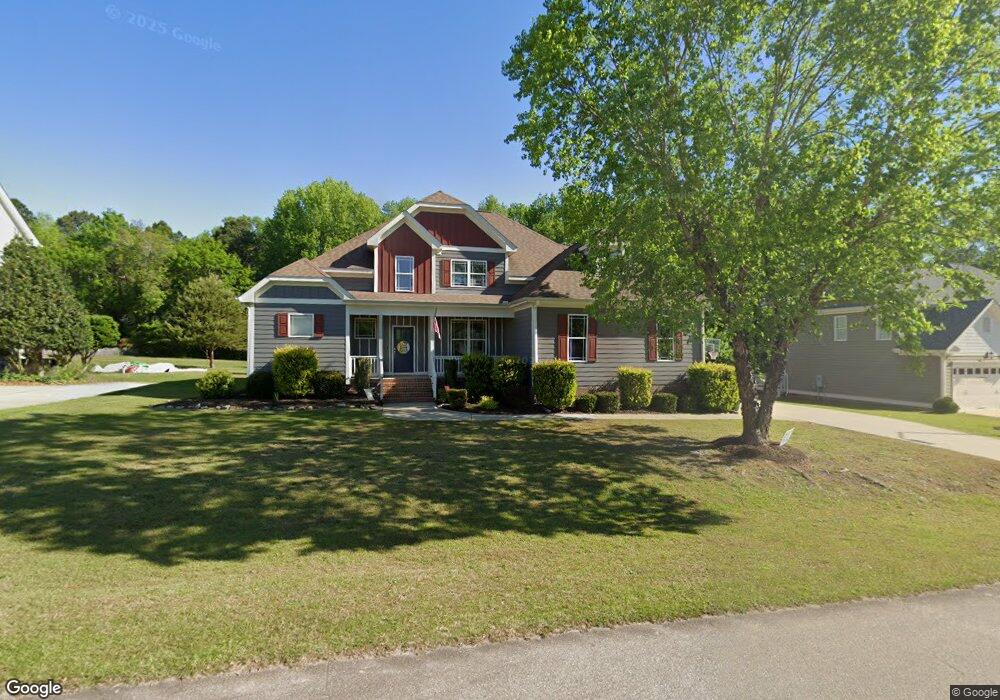
4116 Hampton Park Way Unit Lt9 Fuquay Varina, NC 27526
Estimated Value: $547,159 - $569,000
4
Beds
3
Baths
2,688
Sq Ft
$207/Sq Ft
Est. Value
About This Home
This home is located at 4116 Hampton Park Way Unit Lt9, Fuquay Varina, NC 27526 and is currently estimated at $556,790, approximately $207 per square foot. 4116 Hampton Park Way Unit Lt9 is a home located in Wake County with nearby schools including Carolina Charter Academy.
Ownership History
Date
Name
Owned For
Owner Type
Purchase Details
Closed on
Mar 6, 2024
Sold by
Shirin Mikhail and Shirin Irina
Bought by
Shirin Family Trust
Current Estimated Value
Purchase Details
Closed on
Dec 8, 2023
Sold by
Taylor Kevin D and Taylor Tonya
Bought by
Mikhail Shirin and Mikhail Irina Shirin
Purchase Details
Closed on
Apr 25, 2016
Sold by
Deliberto Gary
Bought by
Taylor Kevin D and Taylor Tonya
Home Financials for this Owner
Home Financials are based on the most recent Mortgage that was taken out on this home.
Original Mortgage
$300,000
Interest Rate
3.68%
Mortgage Type
Seller Take Back
Purchase Details
Closed on
Feb 20, 2008
Sold by
Deliberto Gary
Bought by
Deliberto Gary
Purchase Details
Closed on
Oct 11, 2007
Sold by
Biegger Custom Homes Llc
Bought by
Deliberto Jeanette and Deliberto Gary
Create a Home Valuation Report for This Property
The Home Valuation Report is an in-depth analysis detailing your home's value as well as a comparison with similar homes in the area
Home Values in the Area
Average Home Value in this Area
Purchase History
| Date | Buyer | Sale Price | Title Company |
|---|---|---|---|
| Shirin Family Trust | -- | None Listed On Document | |
| Mikhail Shirin | $480,000 | None Listed On Document | |
| Taylor Kevin D | $327,000 | None Available | |
| Deliberto Gary | -- | None Available | |
| Deliberto Jeanette | $361,000 | None Available |
Source: Public Records
Mortgage History
| Date | Status | Borrower | Loan Amount |
|---|---|---|---|
| Previous Owner | Taylor Kevin D | $300,000 |
Source: Public Records
Tax History Compared to Growth
Tax History
| Year | Tax Paid | Tax Assessment Tax Assessment Total Assessment is a certain percentage of the fair market value that is determined by local assessors to be the total taxable value of land and additions on the property. | Land | Improvement |
|---|---|---|---|---|
| 2025 | $3,552 | $552,275 | $110,000 | $442,275 |
| 2024 | $3,450 | $552,275 | $110,000 | $442,275 |
| 2023 | $2,767 | $352,377 | $52,000 | $300,377 |
| 2022 | $2,565 | $352,377 | $52,000 | $300,377 |
| 2021 | $2,496 | $352,377 | $52,000 | $300,377 |
| 2020 | $2,455 | $352,377 | $52,000 | $300,377 |
| 2019 | $2,536 | $308,029 | $40,000 | $268,029 |
| 2018 | $2,331 | $308,029 | $40,000 | $268,029 |
| 2017 | $2,210 | $308,029 | $40,000 | $268,029 |
| 2016 | $2,165 | $308,029 | $40,000 | $268,029 |
| 2015 | -- | $350,085 | $66,000 | $284,085 |
| 2014 | -- | $350,085 | $66,000 | $284,085 |
Source: Public Records
Map
Nearby Homes
- 1471 Carlton Links Dr
- 8528 Jordan Meadow Dr
- 3825 Wyndfair Dr
- 8529 Kenridge Ln
- 1217 Linkwood Way
- 1900 Pinecliff Ct
- 1319 Richfield Oaks Dr
- 147 Gilmer St
- 148 Gilmer St
- 177 Gilmer St
- 128 Gilmer St
- 194 Gilmer St
- 164 Gilmer St
- NORMAN Plan at Eagle Creek
- LAWSON Plan at Eagle Creek
- EDISTO Plan at Eagle Creek
- KATHRYN Plan at Eagle Creek
- HARTWELL Plan at Eagle Creek
- 3809 Barberry Lake Ct
- 104 Gilmer St
- 4116 Hampton Park Way
- 4104 Hampton Park Way Unit Lt 10
- 4120 Hampton Park Way
- 4120 Hampton Park Way Unit Lt8
- 4124 Hampton Park Way
- 4124 Hampton Park Way Unit Lt7
- 4113 Hampton Park Way
- 4113 Hampton Park Way Unit Lt33
- 4128 Hampton Park Way
- 4128 Hampton Park Way Unit Lt6
- 4117 Hampton Park Way
- 4117 Hampton Park Way Unit Lt34
- 4132 Hampton Park Way
- 4132 Hampton Park Way Unit Lt 5
- 4109 Hampton Park Way
- 4109 Hampton Park Way Unit Lt32
- 4121 Hampton Park Way
- 4121 Hampton Park Way Unit 35
- 4100 Hampton Park Way
- 4105 Hampton Park Way