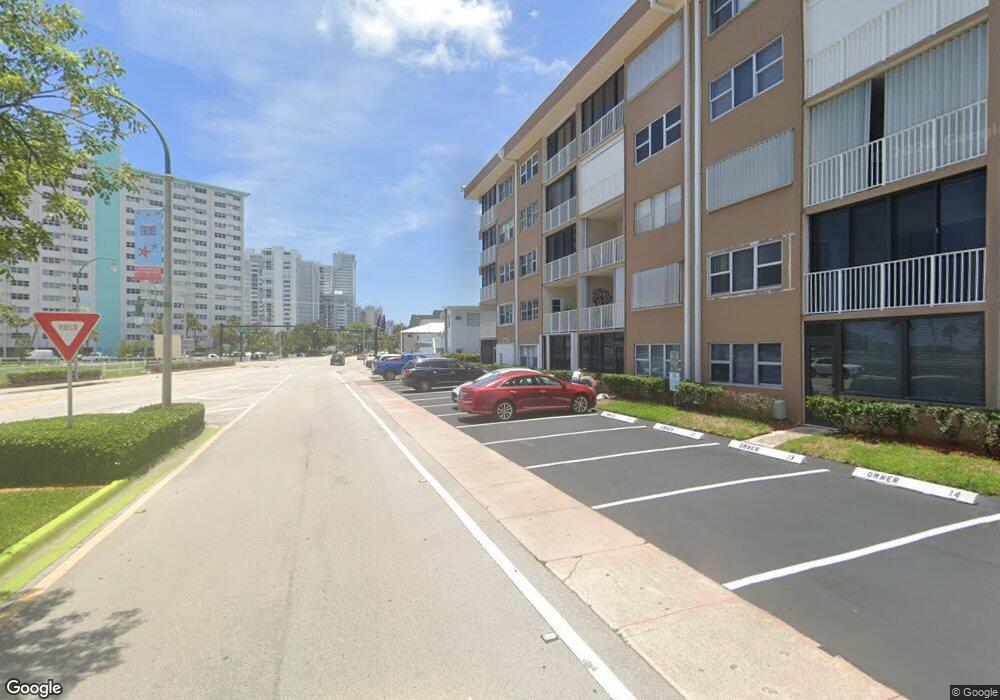
Leisure By The Sea East 4117 Bougainvilla Dr Unit 307 Lauderdale By the Sea, FL 33308
Estimated Value: $319,716 - $475,000
3
Beds
2
Baths
1,030
Sq Ft
$381/Sq Ft
Est. Value
About This Home
This home is located at 4117 Bougainvilla Dr Unit 307, Lauderdale By the Sea, FL 33308 and is currently estimated at $392,929, approximately $381 per square foot. 4117 Bougainvilla Dr Unit 307 is a home located in Broward County with nearby schools including Bayview Elementary School, Sunrise Middle School, and Christ Church School.
Ownership History
Date
Name
Owned For
Owner Type
Purchase Details
Closed on
Feb 28, 2012
Sold by
Butler Thomas L and Butler Kathy B
Bought by
Butler Thomas L
Current Estimated Value
Purchase Details
Closed on
Nov 30, 2001
Sold by
Butler Thomas L
Bought by
Butler Thomas L and Butler Kathy B
Home Financials for this Owner
Home Financials are based on the most recent Mortgage that was taken out on this home.
Original Mortgage
$49,500
Interest Rate
6%
Purchase Details
Closed on
Mar 25, 1997
Sold by
Butler Sandra K
Bought by
Butler Thomas L
Purchase Details
Closed on
Jan 6, 1995
Sold by
Biniker Virginia L
Bought by
Butler Thomas L and Butler Sandra K
Home Financials for this Owner
Home Financials are based on the most recent Mortgage that was taken out on this home.
Original Mortgage
$66,000
Interest Rate
9.14%
Purchase Details
Closed on
Jan 1, 1981
Sold by
Available Not
Bought by
Available Not
Create a Home Valuation Report for This Property
The Home Valuation Report is an in-depth analysis detailing your home's value as well as a comparison with similar homes in the area
Home Values in the Area
Average Home Value in this Area
Purchase History
| Date | Buyer | Sale Price | Title Company |
|---|---|---|---|
| Butler Thomas L | -- | Attorney | |
| Butler Thomas L | -- | Louisville Title Agency For | |
| Butler Thomas L | $30,700 | -- | |
| Butler Thomas L | $99,000 | -- | |
| Available Not | $54,286 | -- |
Source: Public Records
Mortgage History
| Date | Status | Borrower | Loan Amount |
|---|---|---|---|
| Closed | Butler Thomas L | $49,500 | |
| Previous Owner | Butler Thomas L | $66,000 |
Source: Public Records
Tax History Compared to Growth
Tax History
| Year | Tax Paid | Tax Assessment Tax Assessment Total Assessment is a certain percentage of the fair market value that is determined by local assessors to be the total taxable value of land and additions on the property. | Land | Improvement |
|---|---|---|---|---|
| 2025 | $5,512 | $298,770 | $29,880 | $268,890 |
| 2024 | $5,224 | $298,770 | $29,880 | $268,890 |
| 2023 | $5,224 | $263,930 | $0 | $0 |
| 2022 | $4,374 | $239,940 | $23,990 | $215,950 |
| 2021 | $4,048 | $221,890 | $22,190 | $199,700 |
| 2020 | $4,254 | $232,890 | $23,290 | $209,600 |
| 2019 | $3,970 | $215,270 | $21,530 | $193,740 |
| 2018 | $3,759 | $205,530 | $20,550 | $184,980 |
| 2017 | $3,541 | $188,760 | $0 | $0 |
| 2016 | $3,312 | $171,600 | $0 | $0 |
| 2015 | $3,683 | $183,290 | $0 | $0 |
| 2014 | $3,419 | $166,630 | $0 | $0 |
| 2013 | -- | $151,490 | $15,150 | $136,340 |
Source: Public Records
About Leisure By The Sea East
Map
Nearby Homes
- 238 Hibiscus Ave Unit 119
- 234 Hibiscus Ave Unit 271
- 4013 N Ocean Dr Unit 301
- 4013 N Ocean Dr Unit 107
- 4140 N Ocean Dr Unit 102E
- 4143 Seagrape Dr Unit 1-North
- 4143 Seagrape Dr Unit 2
- 4050 N Ocean Dr Unit 1601
- 4050 N Ocean Dr Unit 207
- 4200 N Ocean Dr
- 244 Garden Ct Unit 244
- 246 Garden Ct Unit 246
- 239 Hibiscus Ave
- 240 Shore Ct
- 3900 N Ocean Dr Unit GC
- 244 Shore Ct
- 4228 N Ocean Dr Unit 17
- 246 Shore Ct
- 255 Imperial Ln
- 259 Shore Ct
- 4117 Bougainvilla Dr
- 4117 Bougainvilla Dr Unit 503
- 4117 Bougainvilla Dr Unit 506
- 4117 Bougainvilla Dr Unit 505
- 4117 Bougainvilla Dr Unit 303
- 4117 Bougainvilla Dr Unit 501
- 4117 Bougainvilla Dr Unit 111
- 4117 Bougainvilla Dr Unit 306
- 4117 Bougainvilla Dr Unit 107
- 4117 Bougainvilla Dr Unit 409
- 4117 Bougainvilla Dr Unit 309
- 4117 Bougainvilla Dr Unit 412
- 4117 Bougainvilla Dr Unit 510
- 4117 Bougainvilla Dr Unit 410
- 4117 Bougainvilla Dr Unit 511
- 4117 Bougainvilla Dr Unit 415
- 4117 Bougainvilla Dr Unit 205
- 4117 Bougainvilla Dr Unit 315
- 4117 Bougainvilla Dr Unit 214
- 4117 Bougainvilla Dr Unit 305