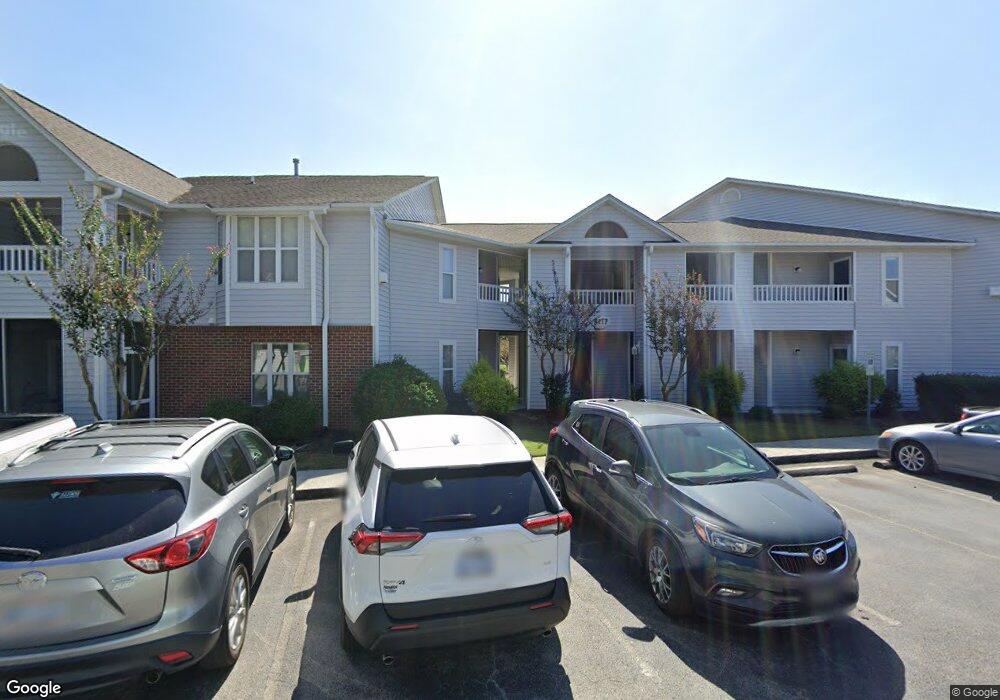
4117 Breezewood Dr Unit B Wilmington, NC 28412
Carriage Hills NeighborhoodEstimated Value: $247,548 - $263,000
2
Beds
2
Baths
1,483
Sq Ft
$172/Sq Ft
Est. Value
About This Home
This home is located at 4117 Breezewood Dr Unit B, Wilmington, NC 28412 and is currently estimated at $255,387, approximately $172 per square foot. 4117 Breezewood Dr Unit B is a home located in New Hanover County with nearby schools including Pine Valley Elementary School, Williston Middle School, and Eugene Ashley High School.
Ownership History
Date
Name
Owned For
Owner Type
Purchase Details
Closed on
Aug 28, 2013
Sold by
Lefevre Wesley O
Bought by
Nicholson Thomas C and Nicholson Martha
Current Estimated Value
Home Financials for this Owner
Home Financials are based on the most recent Mortgage that was taken out on this home.
Original Mortgage
$75,000
Outstanding Balance
$55,596
Interest Rate
4.31%
Mortgage Type
New Conventional
Estimated Equity
$199,791
Purchase Details
Closed on
Jun 16, 2008
Sold by
Dowless Helen H
Bought by
Lefevre Wesley O and Lefevre Mary L
Purchase Details
Closed on
Jun 3, 2005
Sold by
Rabon Donna F
Bought by
Dowless Helen H and Dowless Living Trust
Purchase Details
Closed on
Oct 22, 1996
Sold by
Genesis Built Inc
Bought by
Rabon Donna F
Purchase Details
Closed on
Apr 4, 1996
Sold by
Dansey Jr William E
Bought by
Genesis Built Inc
Create a Home Valuation Report for This Property
The Home Valuation Report is an in-depth analysis detailing your home's value as well as a comparison with similar homes in the area
Home Values in the Area
Average Home Value in this Area
Purchase History
| Date | Buyer | Sale Price | Title Company |
|---|---|---|---|
| Nicholson Thomas C | $105,000 | None Available | |
| Lefevre Wesley O | $146,000 | None Available | |
| Dowless Helen H | $128,000 | None Available | |
| Rabon Donna F | $86,000 | -- | |
| Genesis Built Inc | -- | -- |
Source: Public Records
Mortgage History
| Date | Status | Borrower | Loan Amount |
|---|---|---|---|
| Open | Nicholson Thomas C | $75,000 |
Source: Public Records
Tax History Compared to Growth
Tax History
| Year | Tax Paid | Tax Assessment Tax Assessment Total Assessment is a certain percentage of the fair market value that is determined by local assessors to be the total taxable value of land and additions on the property. | Land | Improvement |
|---|---|---|---|---|
| 2025 | $1,355 | $264,700 | $0 | $264,700 |
| 2023 | $1,355 | $155,800 | $0 | $155,800 |
| 2022 | $1,324 | $155,800 | $0 | $155,800 |
| 2021 | $1,333 | $155,800 | $0 | $155,800 |
| 2020 | $1,282 | $121,700 | $0 | $121,700 |
| 2019 | $1,282 | $121,700 | $0 | $121,700 |
| 2018 | $1,282 | $121,700 | $0 | $121,700 |
| 2017 | $1,282 | $121,700 | $0 | $121,700 |
| 2016 | $1,165 | $105,100 | $0 | $105,100 |
| 2015 | $1,113 | $105,100 | $0 | $105,100 |
| 2014 | $1,066 | $105,100 | $0 | $105,100 |
Source: Public Records
Map
Nearby Homes
- 4117 Breezewood Dr Unit 204
- 4115 Breezewood Dr Unit 202
- 4109 Breezewood Dr Unit 104
- 4109 Breezewood Dr Unit 204
- 4166 Breezewood Dr Unit 103
- 1035 Summerlin Falls Ct
- 1006 Ryans Ct
- 912 Taliga Ln
- 4158 Breezewood Dr Unit 203
- 4142 Breezewood Dr Unit 201
- 4103 Breezewood Dr Unit 104
- 4140 Breezewood Dr Unit 103
- 4130 Breezewood Dr Unit 204
- 928 Taliga Ln
- 4122 Breezewood Dr Unit 203
- 842 Ruffin St
- 4112 Breezewood Dr Unit 101
- 4126 Breezewood Dr Unit 101
- 819 Ruffin St
- 4301 Peeble Dr
- 4119 Breezewood Dr Unit 101
- 4117 Breezewood Dr Unit 102
- 4117 Breezewood Dr Unit 202
- 4119 Breezewood Dr Unit 102
- 4117 Breezewood Dr Unit E
- 4119 Breezewood Dr Unit D
- 4117 Breezewood Dr Unit H
- 4117 Breezewood Dr Unit C
- 4117 Breezewood Dr Unit F
- 4119 Breezewood Dr Unit H
- 4119 Breezewood Dr Unit G
- 4119 Breezewood Dr Unit C
- 4117 Breezewood Dr Unit A
- 4117 Breezewood Dr Unit G
- 4119 Breezewood Dr Unit F
- 4119 Breezewood Dr Unit E
- 4117 Breezewood Dr Unit D
- 4119 Breezewood Dr Unit B
- 4119 Breezewood Dr Unit A
- 4119 Breezewood Dr Unit 201