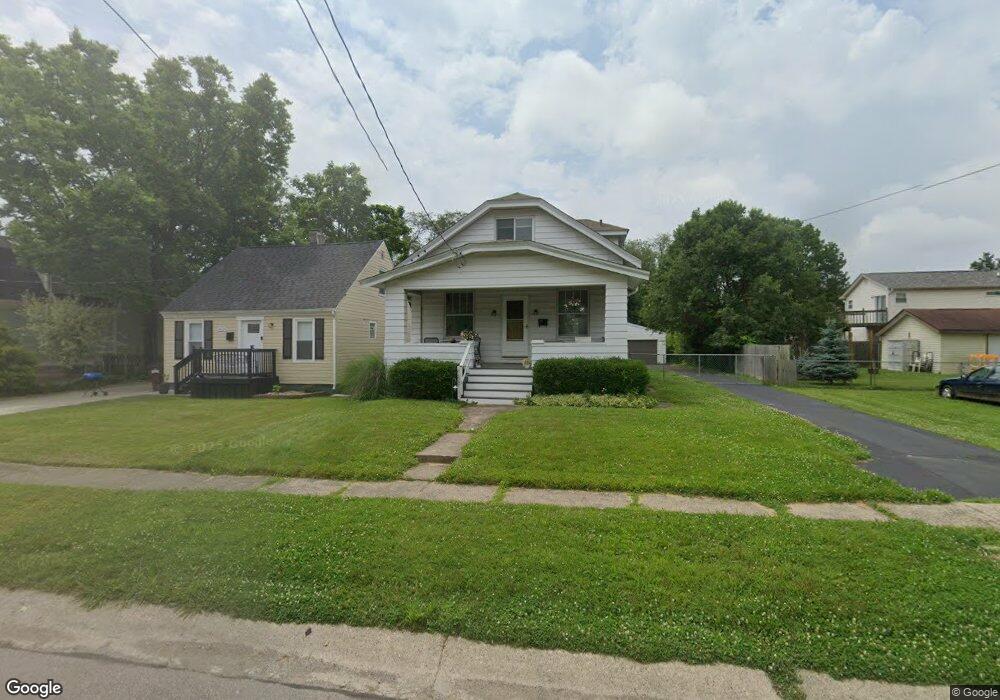
4117 Lansdowne Ave Cincinnati, OH 45236
Estimated Value: $212,000 - $260,000
2
Beds
2
Baths
995
Sq Ft
$235/Sq Ft
Est. Value
About This Home
This home is located at 4117 Lansdowne Ave, Cincinnati, OH 45236 and is currently estimated at $233,814, approximately $234 per square foot. 4117 Lansdowne Ave is a home located in Hamilton County with nearby schools including Amity Elementary School, Deer Park Jr/Sr High School, and Ohr Torah Cincinnati.
Ownership History
Date
Name
Owned For
Owner Type
Purchase Details
Closed on
Jul 26, 2011
Sold by
Burnett Jennifer A
Bought by
Carr Michael A
Current Estimated Value
Home Financials for this Owner
Home Financials are based on the most recent Mortgage that was taken out on this home.
Original Mortgage
$63,000
Outstanding Balance
$42,912
Interest Rate
4.53%
Mortgage Type
New Conventional
Estimated Equity
$190,902
Purchase Details
Closed on
Oct 7, 2010
Sold by
Wagner Andrew and Wagner Jennifer M
Bought by
Wagner Andrew and Wagner Jennifer M
Home Financials for this Owner
Home Financials are based on the most recent Mortgage that was taken out on this home.
Original Mortgage
$91,465
Interest Rate
4.37%
Mortgage Type
New Conventional
Purchase Details
Closed on
Feb 27, 2003
Sold by
Kamp Joseph M and Kamp Joseph
Bought by
Wagner Andrew
Create a Home Valuation Report for This Property
The Home Valuation Report is an in-depth analysis detailing your home's value as well as a comparison with similar homes in the area
Home Values in the Area
Average Home Value in this Area
Purchase History
| Date | Buyer | Sale Price | Title Company |
|---|---|---|---|
| Carr Michael A | $90,000 | Attorney | |
| Wagner Andrew | -- | Attorney | |
| Wagner Andrew | $99,500 | First Title Agency Inc |
Source: Public Records
Mortgage History
| Date | Status | Borrower | Loan Amount |
|---|---|---|---|
| Open | Carr Michael A | $63,000 | |
| Previous Owner | Wagner Andrew | $91,465 |
Source: Public Records
Tax History
| Year | Tax Paid | Tax Assessment Tax Assessment Total Assessment is a certain percentage of the fair market value that is determined by local assessors to be the total taxable value of land and additions on the property. | Land | Improvement |
|---|---|---|---|---|
| 2025 | $3,623 | $48,563 | $11,921 | $36,642 |
| 2024 | $3,118 | $48,563 | $11,921 | $36,642 |
| 2023 | $3,125 | $48,563 | $11,921 | $36,642 |
| 2022 | $3,246 | $38,973 | $9,709 | $29,264 |
| 2021 | $3,232 | $38,973 | $9,709 | $29,264 |
| 2020 | $2,934 | $38,973 | $9,709 | $29,264 |
| 2019 | $2,978 | $35,431 | $8,827 | $26,604 |
| 2018 | $2,976 | $35,431 | $8,827 | $26,604 |
| 2017 | $2,868 | $35,431 | $8,827 | $26,604 |
| 2016 | $2,712 | $32,792 | $8,803 | $23,989 |
| 2015 | $2,457 | $32,792 | $8,803 | $23,989 |
| 2014 | $2,453 | $32,792 | $8,803 | $23,989 |
| 2013 | $2,668 | $35,259 | $9,464 | $25,795 |
Source: Public Records
Map
Nearby Homes
- 7211 Maryland Ave
- 4050 O'Leary Ave
- 4009 Saint Johns Terrace
- 4106 Orchard Ln
- 3982 Superior Ave
- 4025 Deer Park Ave
- 4123 Hoffman Ave
- 7034 East Ave
- 7719 Dearborn Ave
- 4120 Hoffman Ave
- 4248 South Ave
- 4300 Hegner Ave
- 3911 E Gatewood Ln
- 4155 Home St
- 7837 Moss Ct
- 7905 Plainfield Rd
- 4390 Yakima Ct
- 3814 N Broadlawn Cir
- 7633 Montgomery Rd
- 7633 Montgomery Rd Unit 3
- 4119 Lansdowne Ave
- 4123 Lansdowne Ave
- 7314 Plainfield Rd
- 7312 Plainfield Rd
- 7316 Plainfield Rd
- 7308 Plainfield Rd
- 4125 Lansdowne Ave
- 7304 Plainfield Rd
- 4120 Superior Ave
- 4116 Lansdowne Ave
- 4129 Lansdowne Ave
- 4120 Lansdowne Ave
- 4126 Superior Ave
- 7300 Plainfield Rd
- 4122 Lansdowne Ave
- 7404 Plainfield Rd
- 4126 Lansdowne Ave
- 4128 Superior Ave
- 4133 Lansdowne Ave
- 4061 Lansdowne Ave
Your Personal Tour Guide
Ask me questions while you tour the home.