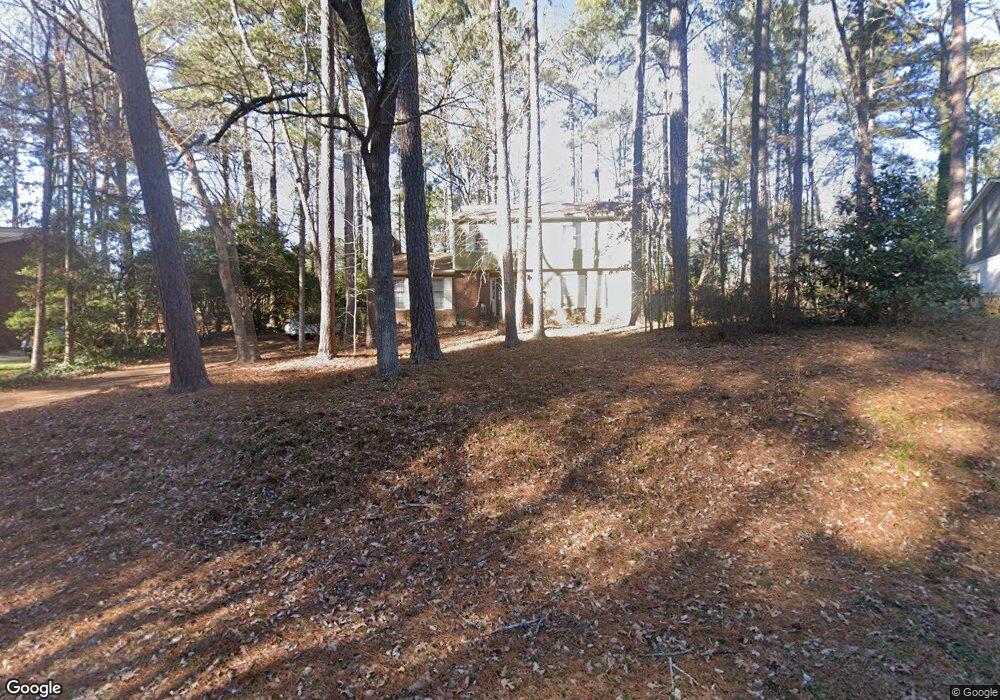
4118 Cobblestone Place Durham, NC 27707
Patterson Place NeighborhoodEstimated Value: $450,167 - $547,000
4
Beds
3
Baths
2,212
Sq Ft
$226/Sq Ft
Est. Value
About This Home
This home is located at 4118 Cobblestone Place, Durham, NC 27707 and is currently estimated at $500,792, approximately $226 per square foot. 4118 Cobblestone Place is a home located in Durham County with nearby schools including Morehead Montessori, Sherwood Githens Middle, and Jordan High School.
Ownership History
Date
Name
Owned For
Owner Type
Purchase Details
Closed on
Jan 28, 2005
Sold by
Bryant Jessica
Bought by
Bryant Keith
Current Estimated Value
Home Financials for this Owner
Home Financials are based on the most recent Mortgage that was taken out on this home.
Original Mortgage
$168,498
Interest Rate
6.69%
Mortgage Type
Fannie Mae Freddie Mac
Purchase Details
Closed on
Feb 18, 2000
Sold by
Gren Douglas and Gren Margaret
Bought by
Bryant Keith and Bryant Jessica
Home Financials for this Owner
Home Financials are based on the most recent Mortgage that was taken out on this home.
Original Mortgage
$161,248
Interest Rate
8.11%
Mortgage Type
FHA
Purchase Details
Closed on
Jun 15, 1999
Sold by
Harrell Loisteen E
Bought by
Gren Douglas and Gren Margaret
Home Financials for this Owner
Home Financials are based on the most recent Mortgage that was taken out on this home.
Original Mortgage
$146,677
Interest Rate
7.04%
Mortgage Type
FHA
Create a Home Valuation Report for This Property
The Home Valuation Report is an in-depth analysis detailing your home's value as well as a comparison with similar homes in the area
Home Values in the Area
Average Home Value in this Area
Purchase History
| Date | Buyer | Sale Price | Title Company |
|---|---|---|---|
| Bryant Keith | -- | -- | |
| Bryant Keith | $165,000 | -- | |
| Gren Douglas | $151,000 | -- |
Source: Public Records
Mortgage History
| Date | Status | Borrower | Loan Amount |
|---|---|---|---|
| Previous Owner | Bryant Keith | $168,498 | |
| Previous Owner | Bryant Keith | $161,248 | |
| Previous Owner | Gren Douglas | $146,677 |
Source: Public Records
Tax History Compared to Growth
Tax History
| Year | Tax Paid | Tax Assessment Tax Assessment Total Assessment is a certain percentage of the fair market value that is determined by local assessors to be the total taxable value of land and additions on the property. | Land | Improvement |
|---|---|---|---|---|
| 2025 | $4,412 | $445,064 | $171,250 | $273,814 |
| 2024 | $3,438 | $246,476 | $55,950 | $190,526 |
| 2023 | $3,229 | $246,476 | $55,950 | $190,526 |
| 2022 | $3,155 | $246,476 | $55,950 | $190,526 |
| 2021 | $3,140 | $246,476 | $55,950 | $190,526 |
| 2020 | $3,066 | $246,476 | $55,950 | $190,526 |
| 2019 | $3,066 | $246,476 | $55,950 | $190,526 |
| 2018 | $2,302 | $169,677 | $40,950 | $128,727 |
| 2017 | $2,285 | $169,677 | $40,950 | $128,727 |
| 2016 | $2,208 | $169,677 | $40,950 | $128,727 |
| 2015 | $2,550 | $184,243 | $38,229 | $146,014 |
| 2014 | $2,550 | $184,243 | $38,229 | $146,014 |
Source: Public Records
Map
Nearby Homes
- 2000 Cotswold Place Unit B
- 2000 Cotswold Place Unit A
- 4008 Livingstone Place
- 4030 King Charles Rd
- 4055 King Charles Rd
- 4035 King Charles Rd
- 4303 Thetford Rd
- 4420 Sun Valley Dr
- 3319 Meadowrun Dr
- 129 Cofield Cir
- 3816 Swarthmore Rd
- 3306 Meadowrun Dr
- 4036 Nottaway Rd
- 3838 Regent Rd
- 3946 Nottaway Rd
- 4220 Hope Valley Rd
- 5515 S Roxboro St Unit 4
- 5515 S Roxboro St Unit 3
- 5515 S Roxboro St Unit 32
- 3829 Regent Rd
- 4116 Cobblestone Place
- 4122 Cobblestone Place
- 4105 Livingstone Place
- 4101 Livingstone Place
- 4035 Livingstone Place
- 4109 Livingstone Place
- 4112 Cobblestone Place
- 4124 Cobblestone Place
- 4031 Livingstone Place
- 4119 Cobblestone Place
- 4115 Cobblestone Place
- 4113 Livingstone Place
- 4123 Cobblestone Place
- 4029 Livingstone Place
- 4117 Livingstone Place
- 4110 Cobblestone Place
- 4109 Cobblestone Place
- 4128 Cobblestone Place
- 4104 Livingstone Place
- 4127 Cobblestone Place