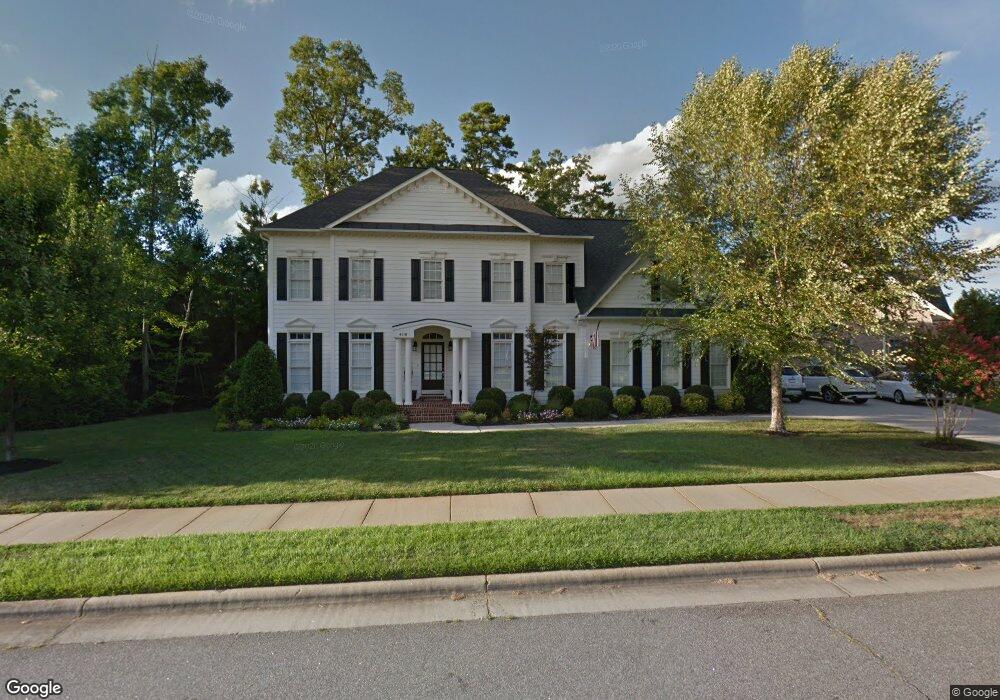
4118 Lathbury Landing Way Cary, NC 27513
West Cary NeighborhoodEstimated Value: $1,037,035 - $1,087,000
4
Beds
4
Baths
3,395
Sq Ft
$311/Sq Ft
Est. Value
About This Home
This home is located at 4118 Lathbury Landing Way, Cary, NC 27513 and is currently estimated at $1,057,509, approximately $311 per square foot. 4118 Lathbury Landing Way is a home located in Wake County with nearby schools including Weatherstone Elementary School, West Cary Middle School, and Green Hope High.
Ownership History
Date
Name
Owned For
Owner Type
Purchase Details
Closed on
Aug 23, 2004
Sold by
John Wieland Homes & Neighborhoods Of Th
Bought by
Roberts William John and Roberts Jane M
Current Estimated Value
Home Financials for this Owner
Home Financials are based on the most recent Mortgage that was taken out on this home.
Original Mortgage
$436,000
Outstanding Balance
$187,075
Interest Rate
4%
Mortgage Type
Purchase Money Mortgage
Estimated Equity
$870,434
Create a Home Valuation Report for This Property
The Home Valuation Report is an in-depth analysis detailing your home's value as well as a comparison with similar homes in the area
Home Values in the Area
Average Home Value in this Area
Purchase History
| Date | Buyer | Sale Price | Title Company |
|---|---|---|---|
| Roberts William John | $553,500 | -- |
Source: Public Records
Mortgage History
| Date | Status | Borrower | Loan Amount |
|---|---|---|---|
| Open | Roberts William John | $436,000 | |
| Closed | Roberts William John | $81,750 |
Source: Public Records
Tax History Compared to Growth
Tax History
| Year | Tax Paid | Tax Assessment Tax Assessment Total Assessment is a certain percentage of the fair market value that is determined by local assessors to be the total taxable value of land and additions on the property. | Land | Improvement |
|---|---|---|---|---|
| 2025 | $8,578 | $998,525 | $300,000 | $698,525 |
| 2024 | $8,393 | $998,525 | $300,000 | $698,525 |
| 2023 | $5,812 | $578,000 | $150,000 | $428,000 |
| 2022 | $5,595 | $578,000 | $150,000 | $428,000 |
| 2021 | $5,482 | $578,000 | $150,000 | $428,000 |
| 2020 | $5,511 | $578,000 | $150,000 | $428,000 |
| 2019 | $6,087 | $566,669 | $166,000 | $400,669 |
| 2018 | $5,712 | $566,669 | $166,000 | $400,669 |
| 2017 | $5,488 | $566,669 | $166,000 | $400,669 |
| 2016 | $5,406 | $566,669 | $166,000 | $400,669 |
| 2015 | $5,852 | $592,385 | $150,000 | $442,385 |
| 2014 | -- | $592,385 | $150,000 | $442,385 |
Source: Public Records
Map
Nearby Homes
- 117 High Country Dr
- 203 Belrose Dr
- 200 Frenchmans Bluff Dr
- 607 Weather Ridge Ln Unit 24
- 615 Weather Ridge Ln Unit 27
- 617 Weather Ridge Ln Unit 32
- 611 Weather Ridge Ln Unit 25
- 2 Bedroom Condos Plan at Weatherstone Creek
- 3 Bedroom Condos Plan at Weatherstone Creek
- 522 Weather Ridge Ln
- 512 Weather Ridge Ln Unit 2
- 621 Weather Ridge Ln Unit 33
- 603 Weather Ridge Ln Unit 22
- 614 Weather Ridge Ln Unit 26
- 618 Weather Ridge Ln Unit 28
- 628 Weather Ridge Ln Unit 36
- 411 Weather Ridge Ln Unit 45
- 671 Bandon Alley
- 695 Bandon Alley
- 403 Belrose Dr
- 4110 Lathbury Landing Way
- 4207 Newington Hills Way
- 4209 Newington Hills Way
- 4104 Lathbury Landing Way
- 4205 Newington Hills Way
- 4117 Lathbury Landing Way
- 4115 Lathbury Landing Way
- 4119 Lathbury Landing Way
- 4121 Lathbury Landing Way
- 4203 Newington Hills Way
- 4301 Newington Hills Way
- 4113 Lathbury Landing Way
- 4102 Lathbury Landing Way
- 4303 Newington Hills Way
- 4111 Lathbury Landing Way
- 4206 Newington Hills Way
- 4208 Newington Hills Way
- 4204 Newington Hills Way
- 4105 Lathbury Landing Way
- 4107 Lathbury Landing Way