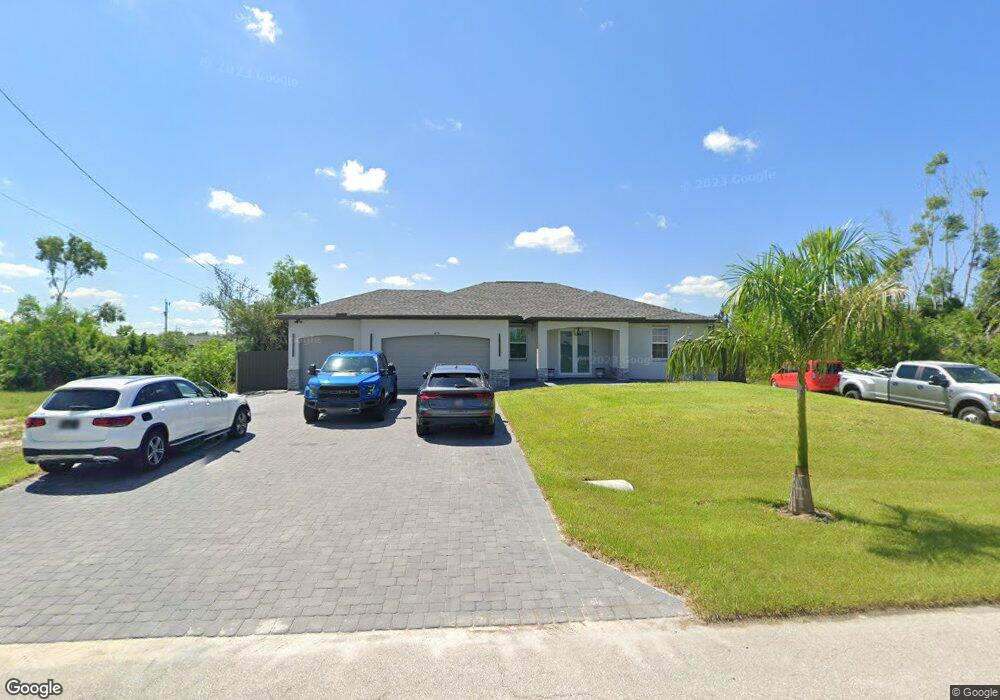
4118 NW 26th St Cape Coral, FL 33993
Burnt Store NeighborhoodEstimated Value: $335,000 - $449,000
4
Beds
2
Baths
2,002
Sq Ft
$192/Sq Ft
Est. Value
About This Home
This home is located at 4118 NW 26th St, Cape Coral, FL 33993 and is currently estimated at $385,249, approximately $192 per square foot. 4118 NW 26th St is a home with nearby schools including Caloosa Elementary School, Dr. Carrie D. Robinson Littleton Elementary School, and Tropic Isles Elementary School.
Ownership History
Date
Name
Owned For
Owner Type
Purchase Details
Closed on
Dec 30, 2021
Sold by
Jhs Builders Llc
Bought by
Orea Annia
Current Estimated Value
Home Financials for this Owner
Home Financials are based on the most recent Mortgage that was taken out on this home.
Original Mortgage
$271,690
Outstanding Balance
$250,396
Interest Rate
3.11%
Mortgage Type
New Conventional
Estimated Equity
$134,853
Purchase Details
Closed on
Apr 22, 2011
Sold by
Herrera Adolfo Leon
Bought by
Asset Quest Llc
Purchase Details
Closed on
Mar 24, 2000
Sold by
Royal West Properties Inc
Bought by
Herrera Adolfo Leon
Home Financials for this Owner
Home Financials are based on the most recent Mortgage that was taken out on this home.
Original Mortgage
$8,000
Interest Rate
8.37%
Purchase Details
Closed on
Oct 1, 1999
Sold by
Bassaline John J and Bassaline Helen A
Bought by
Royal W Properties In
Create a Home Valuation Report for This Property
The Home Valuation Report is an in-depth analysis detailing your home's value as well as a comparison with similar homes in the area
Home Values in the Area
Average Home Value in this Area
Purchase History
| Date | Buyer | Sale Price | Title Company |
|---|---|---|---|
| Orea Annia | $286,000 | Landsel Title Agency Inc | |
| Asset Quest Llc | $2,800 | None Available | |
| Herrera Adolfo Leon | $9,500 | -- | |
| Royal W Properties In | $4,500 | -- |
Source: Public Records
Mortgage History
| Date | Status | Borrower | Loan Amount |
|---|---|---|---|
| Open | Orea Annia | $271,690 | |
| Previous Owner | Herrera Adolfo Leon | $8,000 |
Source: Public Records
Tax History Compared to Growth
Tax History
| Year | Tax Paid | Tax Assessment Tax Assessment Total Assessment is a certain percentage of the fair market value that is determined by local assessors to be the total taxable value of land and additions on the property. | Land | Improvement |
|---|---|---|---|---|
| 2025 | $5,324 | $258,972 | $44,413 | $205,058 |
| 2024 | $5,303 | $323,556 | $44,339 | $265,803 |
| 2023 | $5,303 | $322,533 | $0 | $0 |
| 2022 | $4,819 | $301,318 | $23,805 | $277,513 |
| 2021 | $468 | $11,500 | $11,500 | $0 |
| 2020 | $512 | $13,000 | $13,000 | $0 |
| 2019 | $477 | $12,000 | $12,000 | $0 |
| 2018 | $493 | $16,000 | $16,000 | $0 |
| 2017 | $425 | $10,255 | $10,255 | $0 |
| 2016 | $385 | $8,300 | $8,300 | $0 |
| 2015 | $358 | $8,400 | $8,400 | $0 |
| 2014 | -- | $7,426 | $7,426 | $0 |
| 2013 | -- | $5,300 | $5,300 | $0 |
Source: Public Records
Map
Nearby Homes
- 4129 NW 26th St
- 4119 NW 25th St
- 2521 NW 41st Ave
- 4208 NW 27th St
- 4122 NW 25th St
- 4219 NW 25th St
- 2701 NW 41st Ave
- 2429 NW 41st Ave
- 3722 NW 42nd Place
- 4016 NW 42nd Place
- 2421 NW 41st Ave
- 2500 Old Burnt Store Rd N
- 4114 NW 24th Terrace
- 4114 NW 24th Terra
- 3304 Old Burnt Store Rd N
- 435 Old Burnt Store Rd N
- 3923 Old Burnt Store Rd N
- 1645 Old Burnt Store Rd N
- 3320 Old Burnt Store Rd N
- 4103 Old Burnt Store Rd N
- 4114 NW 26th St Unit 29
- 4117 NW 25th Terrace
- 4121 NW 25th Terrace
- 4200 NW 26th St
- 4121 NW 26th St
- 4125 NW 26th St
- 4201 NW 25th Terrace
- 4129 NW 26th St Unit 18
- 4106 NW 26th St
- 4106 NW 26th St Unit 83
- 4113 NW 26th St
- 4204 NW 26th St
- 4201 NW 26th St
- 4105 NW 25th Terrace
- 4116 NW 25th Terrace
- 4112 NW 25th Terrace
- 4124 NW 25th Terrace
- 4107 NW 26th St
- 4102 NW 26th St
- 4108 NW 25th Terrace