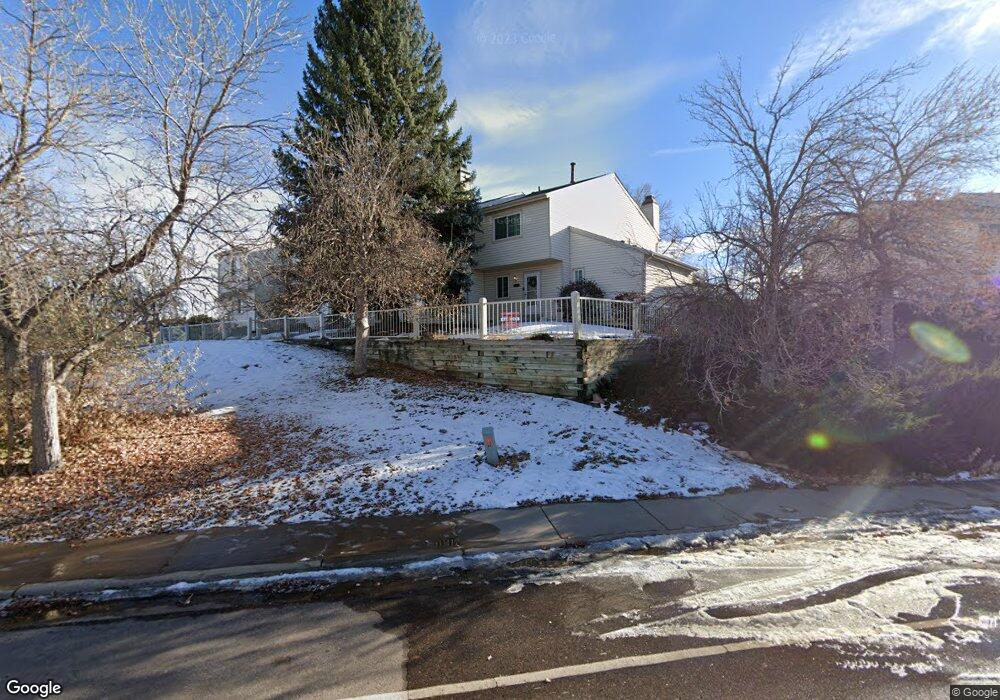
4118 S Mobile Cir Unit C Aurora, CO 80013
Mission Viejo NeighborhoodEstimated Value: $327,000 - $349,000
2
Beds
3
Baths
1,160
Sq Ft
$291/Sq Ft
Est. Value
About This Home
This home is located at 4118 S Mobile Cir Unit C, Aurora, CO 80013 and is currently estimated at $337,277, approximately $290 per square foot. 4118 S Mobile Cir Unit C is a home located in Arapahoe County with nearby schools including Mission Viejo Elementary School, Laredo Middle School, and Smoky Hill High School.
Ownership History
Date
Name
Owned For
Owner Type
Purchase Details
Closed on
Apr 4, 2003
Sold by
Ruble Michelle L
Bought by
Lee Roxanne
Current Estimated Value
Home Financials for this Owner
Home Financials are based on the most recent Mortgage that was taken out on this home.
Original Mortgage
$150,276
Outstanding Balance
$62,003
Interest Rate
5.57%
Estimated Equity
$275,274
Purchase Details
Closed on
Aug 26, 1994
Sold by
Galligan Thomas J and Galligan Kathleen L
Bought by
Ruble Michelle L
Home Financials for this Owner
Home Financials are based on the most recent Mortgage that was taken out on this home.
Original Mortgage
$72,546
Interest Rate
8.46%
Purchase Details
Closed on
Mar 1, 1984
Sold by
Conversion Arapco
Bought by
Conversion Arapco
Purchase Details
Closed on
Jul 4, 1776
Bought by
Conversion Arapco
Create a Home Valuation Report for This Property
The Home Valuation Report is an in-depth analysis detailing your home's value as well as a comparison with similar homes in the area
Home Values in the Area
Average Home Value in this Area
Purchase History
We collect this data history from publicly available records. To have your information removed, we recommend requesting removal directly through your county’s website.
| Date | Buyer | Sale Price | Title Company |
|---|---|---|---|
| Lee Roxanne | $152,400 | -- | |
| Ruble Michelle L | $73,000 | North American Title | |
| Conversion Arapco | -- | -- | |
| Conversion Arapco | -- | -- |
Source: Public Records
Mortgage History
We collect this data history from publicly available records. To have your information removed, we recommend requesting removal directly through your county’s website.
| Date | Status | Borrower | Loan Amount |
|---|---|---|---|
| Open | Lee Roxanne | $150,276 | |
| Previous Owner | Ruble Michelle L | $72,546 |
Source: Public Records
Tax History
| Year | Tax Paid | Tax Assessment Tax Assessment Total Assessment is a certain percentage of the fair market value that is determined by local assessors to be the total taxable value of land and additions on the property. | Land | Improvement |
|---|---|---|---|---|
| 2025 | $1,738 | $22,863 | -- | -- |
| 2024 | $1,533 | $22,157 | -- | -- |
| 2023 | $1,533 | $22,157 | $0 | $0 |
| 2022 | $1,344 | $18,557 | $0 | $0 |
| 2021 | $1,353 | $18,557 | $0 | $0 |
| 2020 | $1,418 | $19,742 | $0 | $0 |
| 2019 | $1,368 | $19,742 | $0 | $0 |
| 2018 | $1,132 | $15,358 | $0 | $0 |
| 2017 | $1,116 | $15,358 | $0 | $0 |
| 2016 | $815 | $10,515 | $0 | $0 |
| 2015 | $775 | $10,515 | $0 | $0 |
| 2014 | -- | $7,379 | $0 | $0 |
| 2013 | -- | $6,980 | $0 | $0 |
Source: Public Records
Map
Nearby Homes
- 4117 S Mobile Cir Unit D
- 4105 S Laredo Way
- 4106 S Laredo Way
- 4138 S Mobile Cir Unit A
- 4177 S Lewiston Cir
- 4212 S Laredo Way
- 15915 E Mercer Cir
- 3793 S Olathe Cir
- 16796 E Kent Dr
- 3927 S Pitkin Way
- 16129 E Rice Place Unit B
- 3752 S Mission Pkwy
- 17212 E Oberlin Place
- 16743 E Kenyon Dr
- 16222 E Rice Place Unit B
- 3877 S Hannibal St
- 3572 S Kittredge St Unit A
- 4075 S Hannibal St
- 3669 S Joplin St
- 3709 S Mission Pkwy
- 4108 S Mobile Cir Unit A
- 4108 S Mobile Cir Unit B
- 4108 S Mobile Cir Unit C
- 4108 S Mobile Cir Unit D
- 4108 S Mobile Cir Unit E
- 4108 S Mobile Cir Unit 4108D
- 4108 S Mobile Cir
- 4106 S Mobile Cir Unit A
- 4106 S Mobile Cir Unit B
- 4106 S Mobile Cir Unit C
- 4106 S Mobile Cir Unit D
- 4106 S Mobile Cir Unit E
- 4106 S Mobile #B Cir
- 4116 S Mobile Cir Unit A
- 4116 S Mobile Cir Unit B
- 4116 S Mobile Cir Unit C
- 4116 S Mobile Cir Unit D
- 4116 S Mobile Cir Unit E
- 4126 S Mobile Cir Unit A
- 4126 S Mobile Cir Unit B
Your Personal Tour Guide
Ask me questions while you tour the home.