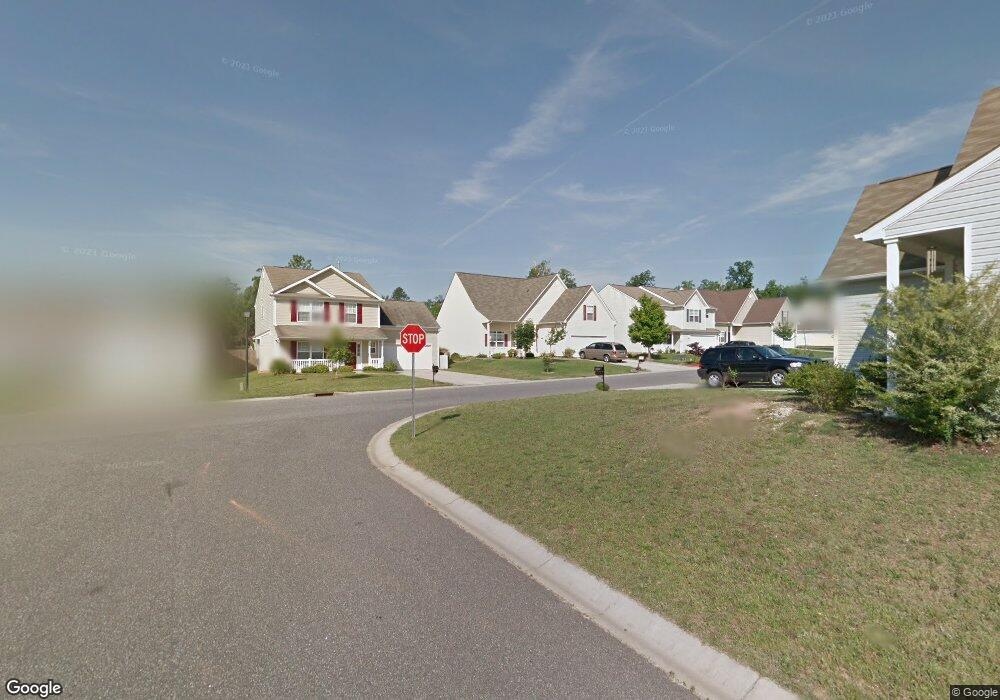
4118 Shasta Cir Clover, SC 29710
Estimated Value: $251,000 - $338,000
--
Bed
1
Bath
2,092
Sq Ft
$138/Sq Ft
Est. Value
About This Home
This home is located at 4118 Shasta Cir, Clover, SC 29710 and is currently estimated at $289,303, approximately $138 per square foot. 4118 Shasta Cir is a home located in York County with nearby schools including Kinard Elementary School, Clover Middle School, and Clover High School.
Ownership History
Date
Name
Owned For
Owner Type
Purchase Details
Closed on
Mar 10, 2023
Sold by
Pendleton Elizabeth C
Bought by
Smith Joshua E and Falls Rhiannon E
Current Estimated Value
Home Financials for this Owner
Home Financials are based on the most recent Mortgage that was taken out on this home.
Original Mortgage
$142,123
Outstanding Balance
$137,339
Interest Rate
6.13%
Mortgage Type
New Conventional
Estimated Equity
$151,964
Purchase Details
Closed on
Nov 17, 2017
Sold by
Pendleton Elizabeth C and Pendleton Ethel Emma
Bought by
Pendleton Elizabeth C and Pendleton Ethel Emma
Purchase Details
Closed on
Mar 10, 2005
Sold by
Craft Homes Usa Llc
Bought by
Pendleton Elizabeth C and Pendleton Ethel Emma
Home Financials for this Owner
Home Financials are based on the most recent Mortgage that was taken out on this home.
Original Mortgage
$40,000
Interest Rate
5.54%
Mortgage Type
Credit Line Revolving
Create a Home Valuation Report for This Property
The Home Valuation Report is an in-depth analysis detailing your home's value as well as a comparison with similar homes in the area
Home Values in the Area
Average Home Value in this Area
Purchase History
| Date | Buyer | Sale Price | Title Company |
|---|---|---|---|
| Smith Joshua E | $150,000 | -- | |
| Pendleton Elizabeth C | -- | None Available | |
| Pendleton Elizabeth C | $148,805 | -- |
Source: Public Records
Mortgage History
| Date | Status | Borrower | Loan Amount |
|---|---|---|---|
| Open | Smith Joshua E | $142,123 | |
| Previous Owner | Pendleton Elizabeth C | $40,000 | |
| Previous Owner | Pendleton Elizabeth C | $108,805 |
Source: Public Records
Tax History Compared to Growth
Tax History
| Year | Tax Paid | Tax Assessment Tax Assessment Total Assessment is a certain percentage of the fair market value that is determined by local assessors to be the total taxable value of land and additions on the property. | Land | Improvement |
|---|---|---|---|---|
| 2025 | $1,881 | $7,564 | $1,630 | $5,934 |
| 2024 | $5,075 | $9,867 | $3,000 | $6,867 |
| 2023 | $1,302 | $6,141 | $1,614 | $4,527 |
| 2022 | $1,176 | $6,141 | $1,614 | $4,527 |
| 2021 | -- | $6,141 | $1,614 | $4,527 |
| 2020 | $1,132 | $6,141 | $0 | $0 |
| 2019 | $1,023 | $5,340 | $0 | $0 |
| 2018 | $1,013 | $5,340 | $0 | $0 |
| 2017 | $959 | $5,340 | $0 | $0 |
| 2016 | $950 | $5,340 | $0 | $0 |
| 2014 | $871 | $5,340 | $1,000 | $4,340 |
| 2013 | $871 | $5,100 | $1,000 | $4,100 |
Source: Public Records
Map
Nearby Homes
- 746 Ladino Ln
- 518 Canopy Ct
- 910 Torsion Ln
- 3948 Shasta Cir
- 405 Drawbar Dr Unit 131
- 420 Drawbar Dr Unit 53
- 424 Drawbar Dr Unit 51
- 393 Drawbar Dr Unit 126
- 3901 Shasta Cir
- 7019 Sonja Dr
- Zina TH Plan at Penley Place Townhomes
- Longfield TH Plan at Penley Place Townhomes
- 3841 Shasta Cir
- 285 Eagle Creek Rd
- 000 Oakland St
- 603 Old North Main St
- 812 Generation Ln
- 814 Generation Ln
- 517 Kittiewake Ln
- 522 Kittiewake Ln
- 4112 Shasta Cir
- 4124 Shasta Cir
- 4106 Shasta Cir
- 4130 Shasta Cir
- 4117 Shasta Cir
- 4111 Shasta Cir
- 4123 Shasta Cir
- 4136 Shasta Cir
- 4100 Shasta Cir
- 4105 Shasta Cir
- 4094 Shasta Cir
- 704 Ladino Ln
- 4142 Shasta Cir
- 4099 Shasta Cir
- 710 Ladino Ln
- 745 Ladino Ln
- 739 Ladino Ln
- 751 Ladino Ln
- 4088 Shasta Cir
- 4093 Shasta Cir