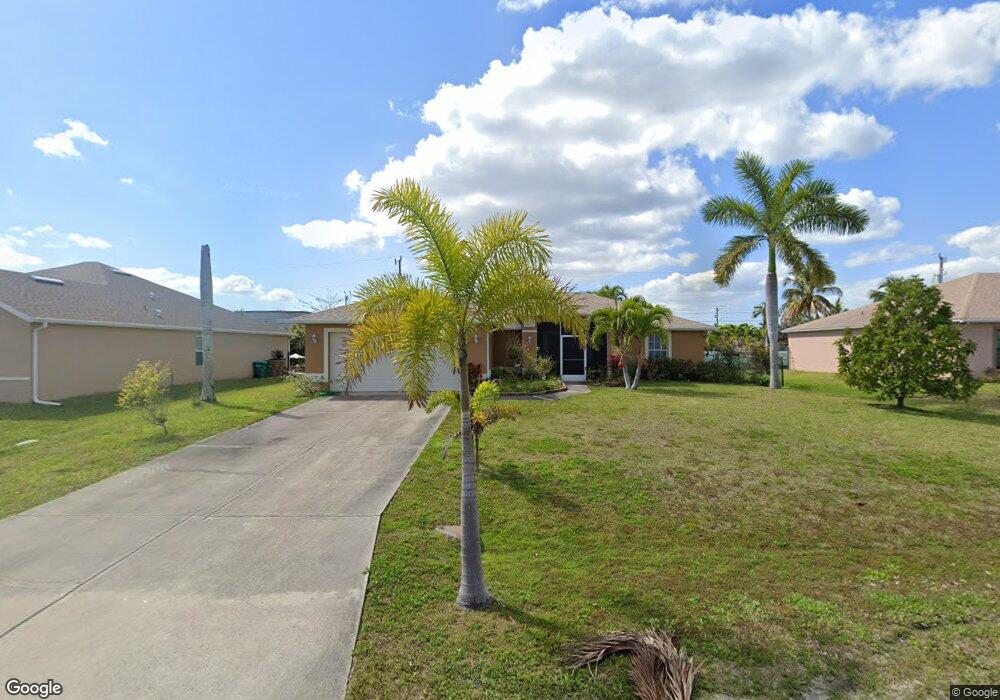
4118 SW 15th Place Unit 65 Cape Coral, FL 33914
Pelican NeighborhoodEstimated Value: $318,849 - $402,000
4
Beds
2
Baths
1,861
Sq Ft
$195/Sq Ft
Est. Value
About This Home
This home is located at 4118 SW 15th Place Unit 65, Cape Coral, FL 33914 and is currently estimated at $363,212, approximately $195 per square foot. 4118 SW 15th Place Unit 65 is a home located in Lee County with nearby schools including Cape Elementary School, Caloosa Elementary School, and Tropic Isles Elementary School.
Ownership History
Date
Name
Owned For
Owner Type
Purchase Details
Closed on
May 1, 2014
Sold by
Blanchard Kerry J and Blanchard Deborah A
Bought by
Lukas Gus and Lukas Judy
Current Estimated Value
Home Financials for this Owner
Home Financials are based on the most recent Mortgage that was taken out on this home.
Original Mortgage
$131,800
Outstanding Balance
$100,821
Interest Rate
4.43%
Mortgage Type
New Conventional
Estimated Equity
$262,391
Purchase Details
Closed on
Aug 29, 2011
Sold by
Pa Fla Home Invesments Llc
Bought by
Blanchard Kerry J and Blanchard Deborah A
Home Financials for this Owner
Home Financials are based on the most recent Mortgage that was taken out on this home.
Original Mortgage
$100,000
Interest Rate
4.53%
Mortgage Type
New Conventional
Purchase Details
Closed on
May 20, 2011
Sold by
Ballesteros Giovanni A
Bought by
Pa Fla Home Investments Llc
Purchase Details
Closed on
Jun 22, 2001
Sold by
Root Judith K and Parks Richard J
Bought by
Ballesteros Giovanni A and Rodriguez Elizabeth
Create a Home Valuation Report for This Property
The Home Valuation Report is an in-depth analysis detailing your home's value as well as a comparison with similar homes in the area
Home Values in the Area
Average Home Value in this Area
Purchase History
| Date | Buyer | Sale Price | Title Company |
|---|---|---|---|
| Lukas Gus | $164,900 | Omnione Title Services Llc | |
| Blanchard Kerry J | $129,900 | Attorney | |
| Pa Fla Home Investments Llc | $85,300 | None Available | |
| Ballesteros Giovanni A | -- | -- | |
| Ballesteros Giovanni A | $2,900 | -- |
Source: Public Records
Mortgage History
| Date | Status | Borrower | Loan Amount |
|---|---|---|---|
| Open | Lukas Gus | $131,800 | |
| Previous Owner | Blanchard Kerry J | $100,000 |
Source: Public Records
Tax History Compared to Growth
Tax History
| Year | Tax Paid | Tax Assessment Tax Assessment Total Assessment is a certain percentage of the fair market value that is determined by local assessors to be the total taxable value of land and additions on the property. | Land | Improvement |
|---|---|---|---|---|
| 2025 | $2,745 | $168,068 | -- | -- |
| 2024 | $2,612 | $163,331 | -- | -- |
| 2023 | $2,612 | $153,574 | $0 | $0 |
| 2022 | $2,466 | $153,955 | $0 | $0 |
| 2021 | $2,470 | $200,348 | $38,666 | $161,682 |
| 2020 | $2,486 | $147,407 | $0 | $0 |
| 2019 | $2,404 | $144,093 | $0 | $0 |
| 2018 | $2,398 | $141,406 | $0 | $0 |
| 2017 | $2,379 | $138,498 | $0 | $0 |
| 2016 | $2,300 | $156,694 | $21,570 | $135,124 |
| 2015 | $2,313 | $134,706 | $16,368 | $118,338 |
| 2014 | $2,760 | $116,704 | $14,868 | $101,836 |
| 2013 | -- | $106,002 | $12,499 | $93,503 |
Source: Public Records
Map
Nearby Homes
- 4125 SW 15th Ave
- 4125 Chiquita Blvd S
- 4213 SW 15th Ave
- 3525-3529 Chiquita Blvd S
- 1600 Beach Pkwy W
- 4015 Chiquita Blvd S
- 4009 Chiquita Blvd S
- 1515 SW 43rd Terrace
- 4004 Chiquita Blvd S
- 1422 Mohawk Pkwy
- 4011 SW 16th Place
- 4304 SW 16th Place
- 4218 SW 17th Ave
- 2303 SW 43rd Terrace
- 4317 SW 16th Place
- 1708 Beach Pkwy W
- 1626 SW 43rd St
- 3930 SW 15th Place
- 1521 SW 43rd Ln
- 1712 Beach Pkwy W Unit 70
- 4114 SW 15th Place
- 4122 SW 15th Place
- 4117CAPE Chiquita Blvd S
- 4117 Chiquita Blvd S
- 4121 Chiquita Blvd S
- 4110 SW 15th Place
- 4126 SW 15th Place
- 4115 SW 15th Place
- 4119 SW 15th Place
- 4109 Chiquita Blvd S
- 4123 SW 15th Place
- 4106 SW 15th Place
- 4132 SW 15th Place Unit 54-56
- 4132 SW 15th Place
- 4107 SW 15th Place
- 4105 Chiquita Blvd S
- 4127 SW 15th Pl Cape Coral Fl
- 4129 Chiquita Blvd S
- 4127 SW 15th Place
- 4120 SW 15th Ave