Estimated Value: $421,000 - $441,257
3
Beds
3
Baths
1,464
Sq Ft
$295/Sq Ft
Est. Value
About This Home
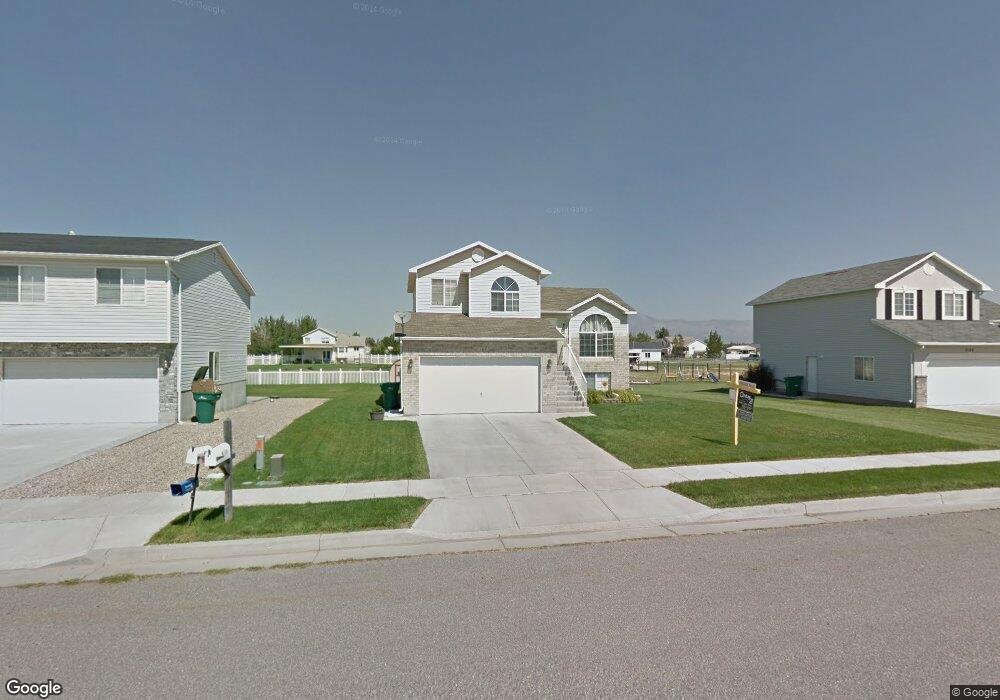
This home is located at 4118 W 4600 S, Roy, UT 84067 and is currently estimated at $431,314, approximately $294 per square foot. 4118 W 4600 S is a home located in Weber County with nearby schools including West Haven School, Sand Ridge Junior High School, and Roy High School.
Ownership History
Date
Name
Owned For
Owner Type
Purchase Details
Closed on
Mar 23, 2020
Sold by
Aschliman Heidi L and Aschliman Robert D
Bought by
Taylor Kodee
Current Estimated Value
Purchase Details
Closed on
Nov 19, 2009
Sold by
Ashliman Heidi L and Aschliman Robert D
Bought by
Aschliman Heidi L and Aschliman Robert D
Home Financials for this Owner
Home Financials are based on the most recent Mortgage that was taken out on this home.
Original Mortgage
$12,575
Interest Rate
4.83%
Mortgage Type
New Conventional
Purchase Details
Closed on
Oct 27, 2005
Sold by
Bodily Travis and Bodily Chadlianne
Bought by
Aschliman Robert D and Hess Heidi L
Home Financials for this Owner
Home Financials are based on the most recent Mortgage that was taken out on this home.
Original Mortgage
$137,344
Interest Rate
5.68%
Mortgage Type
FHA
Purchase Details
Closed on
Jul 20, 2001
Sold by
Great American Homes Inc
Bought by
Bodily Travis and Bodily Chadlianne
Home Financials for this Owner
Home Financials are based on the most recent Mortgage that was taken out on this home.
Original Mortgage
$121,871
Interest Rate
7.21%
Create a Home Valuation Report for This Property
The Home Valuation Report is an in-depth analysis detailing your home's value as well as a comparison with similar homes in the area
Home Values in the Area
Average Home Value in this Area
Purchase History
| Date | Buyer | Sale Price | Title Company |
|---|---|---|---|
| Taylor Kodee | -- | Nothern Title Co | |
| Aschliman Heidi L | -- | First American Title | |
| Aschliman Robert D | -- | Inwest Title Ogden | |
| Bodily Travis | -- | Bonneville Title |
Source: Public Records
Mortgage History
| Date | Status | Borrower | Loan Amount |
|---|---|---|---|
| Previous Owner | Aschliman Heidi L | $12,575 | |
| Previous Owner | Aschliman Robert D | $137,344 | |
| Previous Owner | Bodily Travis | $121,871 |
Source: Public Records
Tax History Compared to Growth
Tax History
| Year | Tax Paid | Tax Assessment Tax Assessment Total Assessment is a certain percentage of the fair market value that is determined by local assessors to be the total taxable value of land and additions on the property. | Land | Improvement |
|---|---|---|---|---|
| 2025 | $2,489 | $392,354 | $131,826 | $260,528 |
| 2024 | $2,431 | $386,000 | $131,826 | $254,174 |
| 2023 | $2,397 | $382,000 | $126,328 | $255,672 |
| 2022 | $2,451 | $403,000 | $110,803 | $292,197 |
| 2021 | $2,022 | $300,000 | $80,780 | $219,220 |
| 2020 | $1,954 | $267,000 | $80,780 | $186,220 |
| 2019 | $1,855 | $238,000 | $50,573 | $187,427 |
| 2018 | $1,630 | $194,672 | $42,684 | $151,988 |
| 2017 | $1,610 | $180,763 | $42,684 | $138,079 |
| 2016 | $1,440 | $85,993 | $22,192 | $63,801 |
| 2015 | $1,289 | $78,114 | $22,192 | $55,922 |
| 2014 | $1,138 | $66,753 | $19,471 | $47,282 |
Source: Public Records
Map
Nearby Homes
- 4094 W 4700 S
- 4024 W 4650 S
- 4097 W 4750 S
- 4756 S 4300 W
- 4106 W 4875 S
- 4141 W 4875 S
- 4890 S 4075 W
- 4990 S 4075 W
- 5013 S 4150 W
- 4021 W 5000 S
- 4218 W 5050 S
- 3692 W 4625 S
- 3671 W 4700 S
- 3652 W 4625 S
- Villages Townhome Plan at Green Farm - Villages
- 3632 W 4650 S
- 3627 W 4650 S
- 3820 Foxglen Dr
- 5116 S 4300 W
- 4556 W 4950 S
- 4124 W 4600 S
- 4108 W 4600 S
- 4108 W 4600 S Unit 42
- 4130 W 4600 S
- 4119 W 4600 S Unit 30
- 4102 W 4600 S
- 4123 W 4600 S
- 4134 W 4600 S
- 4109 W 4600 S
- 4109 W 4600 S Unit 43
- 4131 W 4600 S
- 4142 W 4600 S
- 4126 W 4650 S
- 4105 W 4600 S
- 4105 W 4600 S Unit 44
- 4620 S 4150 W
- 4101 W 4600 S
- 4101 W 4600 S Unit 45
- 4092 W 4600 S
- 4092 W 4600 S Unit 40