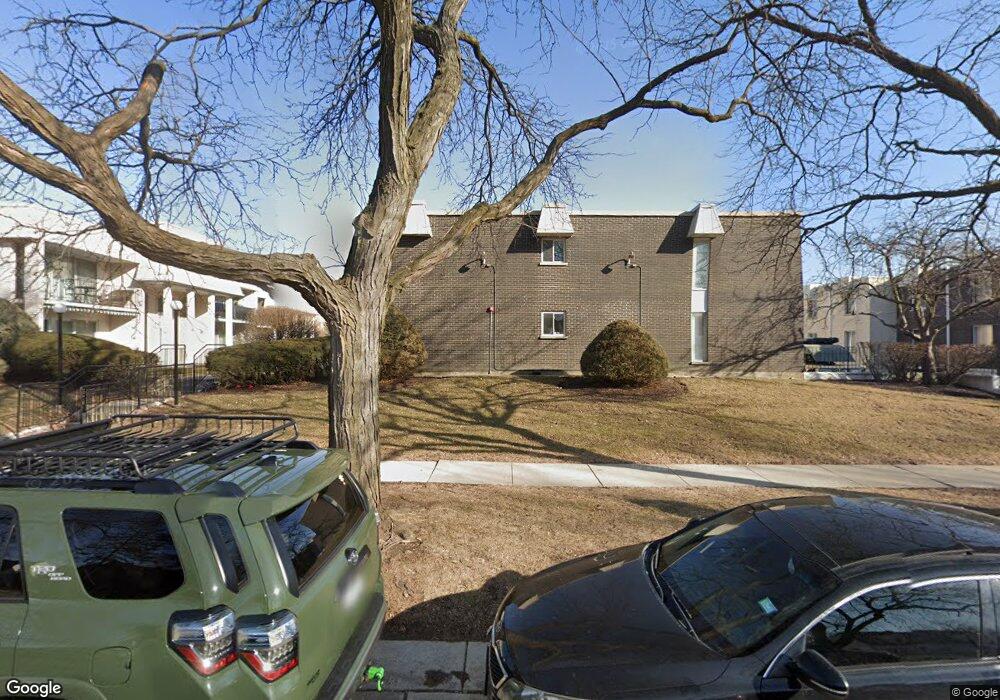
4118 W 99th St Unit 4118A Oak Lawn, IL 60453
Estimated Value: $202,000 - $216,000
2
Beds
2
Baths
1,132
Sq Ft
$184/Sq Ft
Est. Value
About This Home
This home is located at 4118 W 99th St Unit 4118A, Oak Lawn, IL 60453 and is currently estimated at $208,014, approximately $183 per square foot. 4118 W 99th St Unit 4118A is a home located in Cook County with nearby schools including Sward Elementary School, Kolmar Avenue Elementary School, and Hometown Elementary School.
Ownership History
Date
Name
Owned For
Owner Type
Purchase Details
Closed on
Jun 13, 2023
Sold by
Carmona Manuel and Carmona Tania
Bought by
Baker Amber L
Current Estimated Value
Home Financials for this Owner
Home Financials are based on the most recent Mortgage that was taken out on this home.
Original Mortgage
$7,500
Outstanding Balance
$1,075
Interest Rate
6.79%
Mortgage Type
New Conventional
Estimated Equity
$206,939
Purchase Details
Closed on
Feb 28, 2019
Sold by
First Midwest Bank
Bought by
Carmona Manuel and Cuenca Tania
Home Financials for this Owner
Home Financials are based on the most recent Mortgage that was taken out on this home.
Original Mortgage
$101,650
Interest Rate
4.4%
Mortgage Type
New Conventional
Purchase Details
Closed on
Aug 31, 2006
Sold by
Suburban Bank & Trust Co
Bought by
Standard Bank & Trust Co and Trust #19590
Purchase Details
Closed on
Dec 9, 1994
Sold by
Mcglinn Patricia A
Bought by
Beverly Trust Company
Create a Home Valuation Report for This Property
The Home Valuation Report is an in-depth analysis detailing your home's value as well as a comparison with similar homes in the area
Home Values in the Area
Average Home Value in this Area
Purchase History
| Date | Buyer | Sale Price | Title Company |
|---|---|---|---|
| Baker Amber L | $195,000 | Stewart Title | |
| Carmona Manuel | $107,000 | None Available | |
| Standard Bank & Trust Co | -- | None Available | |
| Beverly Trust Company | -- | -- |
Source: Public Records
Mortgage History
| Date | Status | Borrower | Loan Amount |
|---|---|---|---|
| Open | Baker Amber L | $7,500 | |
| Open | Baker Amber L | $185,250 | |
| Previous Owner | Carmona Manuel | $101,650 |
Source: Public Records
Tax History Compared to Growth
Tax History
| Year | Tax Paid | Tax Assessment Tax Assessment Total Assessment is a certain percentage of the fair market value that is determined by local assessors to be the total taxable value of land and additions on the property. | Land | Improvement |
|---|---|---|---|---|
| 2024 | $4,461 | $14,585 | $1,129 | $13,456 |
| 2023 | $3,783 | $14,585 | $1,129 | $13,456 |
| 2022 | $3,783 | $9,990 | $1,371 | $8,619 |
| 2021 | $1,479 | $9,988 | $1,370 | $8,618 |
| 2020 | $1,599 | $9,988 | $1,370 | $8,618 |
| 2019 | $229 | $6,805 | $1,249 | $5,556 |
| 2018 | $217 | $6,805 | $1,249 | $5,556 |
| 2017 | $255 | $6,805 | $1,249 | $5,556 |
| 2016 | $1,065 | $7,188 | $1,048 | $6,140 |
| 2015 | $975 | $7,188 | $1,048 | $6,140 |
| 2014 | $998 | $7,188 | $1,048 | $6,140 |
| 2013 | $2,550 | $12,434 | $1,048 | $11,386 |
Source: Public Records
Map
Nearby Homes
- 4108 W 99th St Unit C
- 4123 W 98th St Unit C
- 9831 S Karlov Ave
- 4037 Trafalgar Ln
- 4119 W 98th St Unit A
- 9820 S Pulaski Rd Unit 3142
- 9724 S Karlov Ave Unit 4103
- 9745 S Karlov Ave Unit 607
- 9720 S Pulaski Rd Unit 306
- 4125 W 97th Place Unit 206
- 4320 W 99th Place
- 9725 S Karlov Ave Unit 610
- 9725 S Karlov Ave Unit 501
- 9725 S Karlov Ave Unit 402
- 9725 S Karlov Ave Unit 401
- 4325 W 99th Place
- 10048 S Pulaski Rd Unit 1E
- 10008 S Kolin Ave
- 9620 S Keeler Ave
- 9716 S Harding Ave
- 4118 W 99th St Unit B
- 4118 W 99th St Unit 4118C
- 4118 W 99th St Unit 4118D
- 4118 W 99th St Unit 4118B
- 4118 W 99th St Unit A
- 4118 W 99th St Unit D
- 4118 W 99th St Unit C
- 4118 W 99th St Unit 1
- 4120 W 99th St Unit 4120A
- 4120 W 99th St Unit 4120D
- 4120 W 99th St Unit 4120C
- 4120 W 99th St Unit 4120B
- 4120 W 99th St Unit B
- 4120 W 99th St Unit A
- 4116 W 99th St Unit 4116A
- 4116 W 99th St Unit 4116C
- 4116 W 99th St Unit 4116D
- 4116 W 99th St Unit 4116B
- 4116 W 99th St Unit C
- 4116 W 99th St Unit D