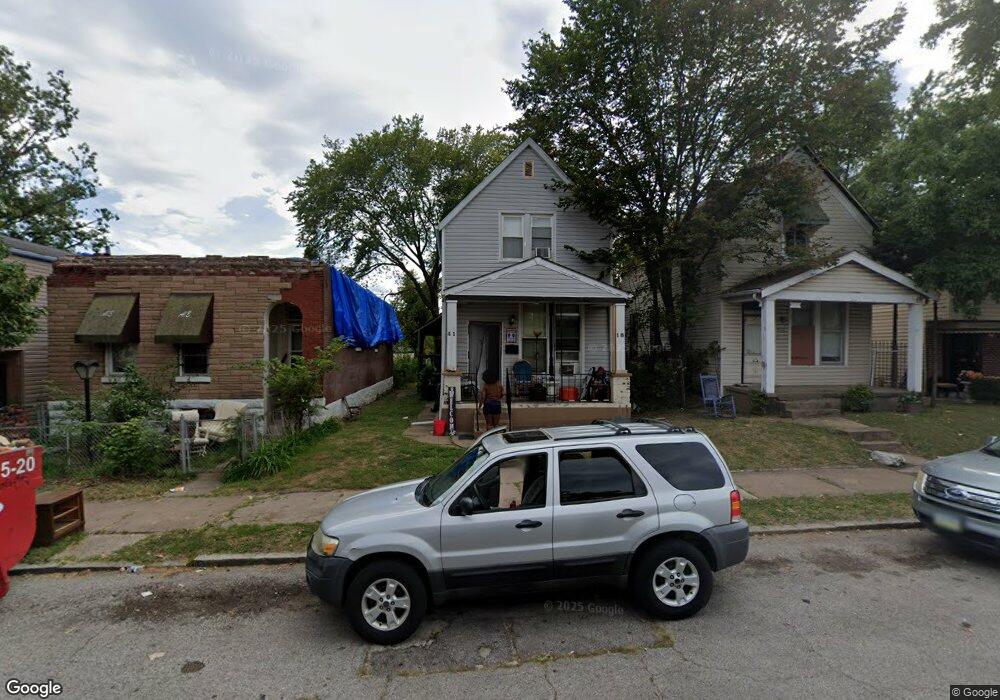
4118 W Carter Ave Saint Louis, MO 63115
O'Fallon NeighborhoodEstimated Value: $36,000 - $73,000
2
Beds
1
Bath
1,036
Sq Ft
$51/Sq Ft
Est. Value
About This Home
This home is located at 4118 W Carter Ave, Saint Louis, MO 63115 and is currently estimated at $52,945, approximately $51 per square foot. 4118 W Carter Ave is a home located in St. Louis City with nearby schools including Ashland Elementary School, Yeatman-Liddell Middle School, and Vashon High School.
Ownership History
Date
Name
Owned For
Owner Type
Purchase Details
Closed on
Oct 10, 2024
Sold by
Quach Xuyen Nhu
Bought by
Williams Nikki
Current Estimated Value
Purchase Details
Closed on
Dec 2, 2016
Sold by
Nuh Xuyen Quach
Bought by
Nuh Xuyen Quach and Williams Nikki
Purchase Details
Closed on
Aug 16, 2007
Sold by
Quach Xuyen Nhu
Bought by
Quach Xuyen Nuh and Pham Thanh
Purchase Details
Closed on
Aug 15, 2007
Sold by
Banks Emanuel
Bought by
Quach Xuyen Nhu
Purchase Details
Closed on
Jul 25, 2007
Sold by
Deutsche Bank National Trust Co
Bought by
Atchinson Donna S
Purchase Details
Closed on
Jun 1, 2006
Sold by
Wells Fargo Bank Na
Bought by
Banks Emanuel
Purchase Details
Closed on
Sep 6, 2005
Sold by
Harvey Eric F and Harvey Berlinda
Bought by
Wells Fargo Bank Na and Amresco Residential Securities Corp
Purchase Details
Closed on
Oct 17, 1996
Sold by
Juanita Hughes
Bought by
Harvey Eric F
Create a Home Valuation Report for This Property
The Home Valuation Report is an in-depth analysis detailing your home's value as well as a comparison with similar homes in the area
Home Values in the Area
Average Home Value in this Area
Purchase History
| Date | Buyer | Sale Price | Title Company |
|---|---|---|---|
| Williams Nikki | -- | None Listed On Document | |
| Nuh Xuyen Quach | -- | None Available | |
| Quach Xuyen Nuh | -- | None Available | |
| Quach Xuyen Nhu | -- | None Available | |
| Atchinson Donna S | -- | Mokan Title Services Llc | |
| Banks Emanuel | -- | Ort | |
| Wells Fargo Bank Na | $44,175 | None Available | |
| Harvey Eric F | -- | -- |
Source: Public Records
Tax History Compared to Growth
Tax History
| Year | Tax Paid | Tax Assessment Tax Assessment Total Assessment is a certain percentage of the fair market value that is determined by local assessors to be the total taxable value of land and additions on the property. | Land | Improvement |
|---|---|---|---|---|
| 2025 | $152 | $1,530 | $270 | $1,260 |
| 2024 | $146 | $1,480 | $270 | $1,210 |
| 2023 | $146 | $1,480 | $270 | $1,210 |
| 2022 | $149 | $1,460 | $270 | $1,190 |
| 2021 | $148 | $1,460 | $270 | $1,190 |
| 2020 | $148 | $1,460 | $270 | $1,190 |
| 2019 | $147 | $1,470 | $270 | $1,200 |
| 2018 | $145 | $1,390 | $270 | $1,120 |
| 2017 | $143 | $1,390 | $270 | $1,120 |
| 2016 | $166 | $1,650 | $530 | $1,120 |
| 2015 | $153 | $1,650 | $530 | $1,120 |
| 2014 | $172 | $1,650 | $530 | $1,120 |
| 2013 | -- | $1,900 | $530 | $1,370 |
Source: Public Records
Map
Nearby Homes
- 4210 E Carter Ave
- 4219 Red Bud Ave
- 4224 Penrose St
- 3931 Lee Ave
- 4450 Holly Ave
- 4110 Red Bud Ave
- 4419 Holly Ave
- 4253 Holly Ave
- 4237 Holly Ave
- 4535 Holly Ave
- 4136 Farlin Ave
- 4166 Farlin Ave
- 4537 Clarence Ave
- 4239 E Margaretta Ave
- 4608 Pope Ave
- 4610 Pope Ave
- 3937 Lee Ave
- 4421 Anderson Ave
- 2032 E Adelaide Ave
- 4132 San Francisco Ave
- 4116 W Carter Ave
- 4120 W Carter Ave
- 4114 W Carter Ave
- 4124 W Carter Ave
- 4128 W Carter Ave
- 4132 W Carter Ave
- 4261 Fair Ave
- 4259 Fair Ave
- 4265 Fair Ave
- 4253 Fair Ave
- 4267 Fair Ave
- 4251 Fair Ave
- 4134 W Carter Ave
- 4121 W Green Lea Place
- 4249 Fair Ave
- 4119 W Carter Ave Unit 4119 West Carter
- 4119 W Carter Ave Unit 4119 Carter Ave
- 4117 W Carter Ave
- 4117 W Carter Ave Unit 4117 Carter
- 4136 W Carter Ave