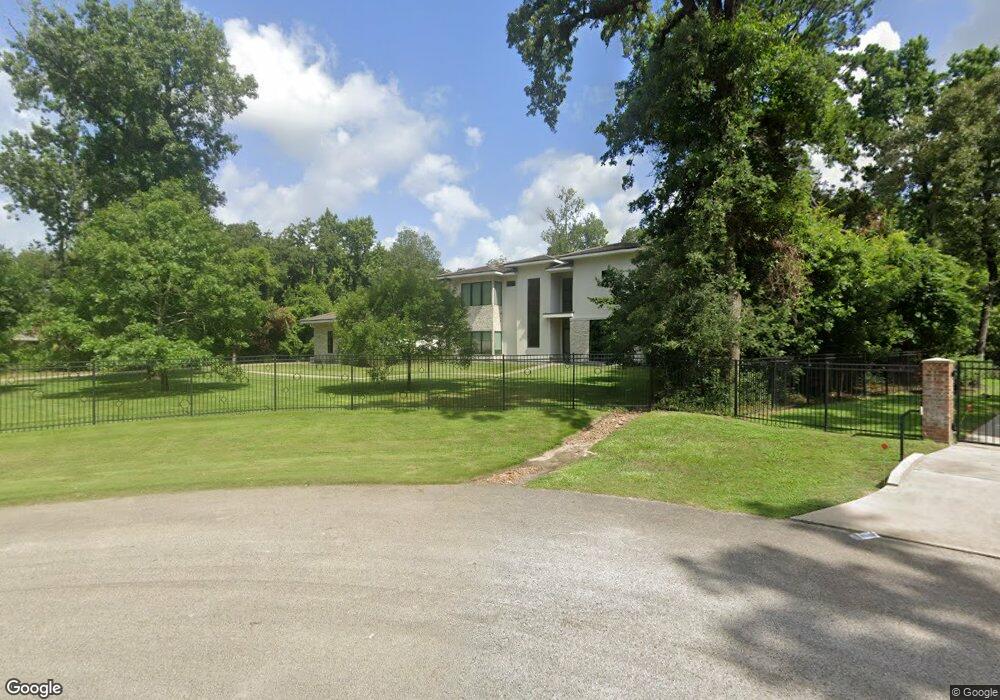
4119 Calvert Cove Spring, TX 77386
Benders Landing NeighborhoodEstimated Value: $1,416,735 - $1,444,000
--
Bed
2
Baths
5,409
Sq Ft
$263/Sq Ft
Est. Value
About This Home
This home is located at 4119 Calvert Cove, Spring, TX 77386 and is currently estimated at $1,424,934, approximately $263 per square foot. 4119 Calvert Cove is a home located in Montgomery County with nearby schools including Snyder Elementary School, York J High School, and Grand Oaks High School.
Ownership History
Date
Name
Owned For
Owner Type
Purchase Details
Closed on
Jul 19, 2022
Sold by
Blackburn Shawn D
Bought by
Shawn Blackburn And Leslie Ann Blackburn Revo
Current Estimated Value
Purchase Details
Closed on
Jul 29, 2019
Sold by
Checo Pedro R and Leckova Zuzana
Bought by
Blackburn Shawn D and Blackburn Leslie A
Home Financials for this Owner
Home Financials are based on the most recent Mortgage that was taken out on this home.
Original Mortgage
$760,000
Interest Rate
3.82%
Mortgage Type
New Conventional
Purchase Details
Closed on
Mar 5, 2013
Sold by
Thomas Patricia M
Bought by
Checo Pedro R
Purchase Details
Closed on
Apr 12, 2006
Sold by
Lavergne Gregory T and Lavergne Donna
Bought by
Thomas Patricia M
Purchase Details
Closed on
Jun 7, 2005
Sold by
Allan Jeffrey R
Bought by
Lavergne Gregory T and Lavergne Donna
Create a Home Valuation Report for This Property
The Home Valuation Report is an in-depth analysis detailing your home's value as well as a comparison with similar homes in the area
Home Values in the Area
Average Home Value in this Area
Purchase History
| Date | Buyer | Sale Price | Title Company |
|---|---|---|---|
| Shawn Blackburn And Leslie Ann Blackburn Revo | -- | Riddle & Butts Llp | |
| Blackburn Shawn D | -- | Chicago Title | |
| Checo Pedro R | -- | -- | |
| Thomas Patricia M | -- | American Title Co | |
| Lavergne Gregory T | -- | -- |
Source: Public Records
Mortgage History
| Date | Status | Borrower | Loan Amount |
|---|---|---|---|
| Previous Owner | Blackburn Shawn D | $760,000 |
Source: Public Records
Tax History Compared to Growth
Tax History
| Year | Tax Paid | Tax Assessment Tax Assessment Total Assessment is a certain percentage of the fair market value that is determined by local assessors to be the total taxable value of land and additions on the property. | Land | Improvement |
|---|---|---|---|---|
| 2025 | $19,480 | $1,450,000 | $443,083 | $1,006,917 |
| 2024 | $17,595 | $1,384,313 | -- | -- |
| 2023 | $17,595 | $1,258,470 | $274,430 | $1,025,570 |
| 2022 | $22,210 | $1,280,020 | $248,470 | $1,031,550 |
| 2021 | $19,874 | $1,075,000 | $151,510 | $923,490 |
| 2020 | $18,382 | $945,500 | $151,510 | $793,990 |
| 2019 | $19,692 | $977,570 | $126,000 | $851,570 |
| 2018 | $17,666 | $947,640 | $126,000 | $821,640 |
| 2017 | $19,063 | $947,640 | $126,000 | $821,640 |
| 2016 | $19,063 | $947,640 | $126,000 | $821,640 |
| 2015 | $1,646 | $947,640 | $126,000 | $821,640 |
| 2014 | $1,646 | $81,000 | $81,000 | $0 |
Source: Public Records
Map
Nearby Homes
- 28212 Cedar Peak Dr
- 28228 Cedar Peak Dr
- 4603 Silver Moon Dr
- 4582 Silver Moon Dr
- 28295 Emerald Bend
- 5361 Cherry Spring Dr
- 4527 Silver Moon Dr
- TBD Old Riley Fuzzel Rd
- 28337 Sterling Oak Dr
- 4349 Victoria Pine Dr
- 4345 Victoria Pine Dr
- 27322 Whispering Maple Way
- 27318 Whispering Maple Way
- 4226 Davis Oak Dr
- 5514 Harvest Oak Landing Dr
- 5217 Liberty Cove Dr
- 4300 Silver Oak Place
- 28210 & 28214 E Benders Landing Blvd
- 3811 Rayford Rd
- 27919 Inspire Crest Landing
- 4119 Calvert Cove Ct
- 4123 Calvert Cove Ct
- 4115 Calvert Cove Ct
- 4110 Francisco Ct
- 4114 Francisco Ct
- 4106 Francisco Ct
- 4107 Calvert Cove Ct
- 4118 Calvert Cove Ct
- 28203 Cedar Peak Dr
- 4114 Calvert Cove Ct
- 4102 Francisco Ct
- 330 Calvary Cove
- 000 Calvary Cove Lot 23
- 28208 Cedar Peak Dr
- 28208 Cedar Peak Dr
- 28227 Cedar Peak Dr
- 4115 Francisco Ct
- 5585 Fallen Antler Dr
- 28211 Cedar Peak Dr
- 4110 Calvert Cove Ct