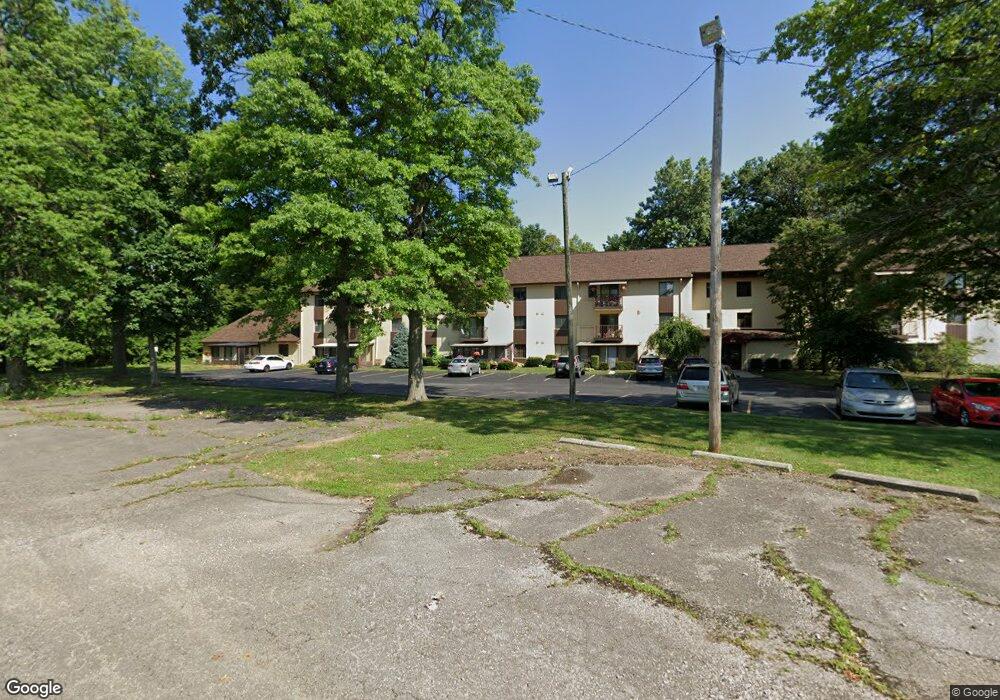
4119 Karl Rd Unit C201 Columbus, OH 43224
Clinton Estates NeighborhoodEstimated Value: $95,018 - $100,000
1
Bed
2
Baths
966
Sq Ft
$100/Sq Ft
Est. Value
About This Home
This home is located at 4119 Karl Rd Unit C201, Columbus, OH 43224 and is currently estimated at $96,755, approximately $100 per square foot. 4119 Karl Rd Unit C201 is a home located in Franklin County with nearby schools including Maize Road Elementary School, Medina Middle School, and Mifflin High School.
Ownership History
Date
Name
Owned For
Owner Type
Purchase Details
Closed on
Jun 30, 2004
Sold by
Eudy Sharon L and Eudy Hershel R
Bought by
Chandler Robert L and Chandler Nancy J
Current Estimated Value
Home Financials for this Owner
Home Financials are based on the most recent Mortgage that was taken out on this home.
Original Mortgage
$36,700
Interest Rate
6.37%
Mortgage Type
Purchase Money Mortgage
Purchase Details
Closed on
May 26, 2004
Sold by
Estate Of Clara Rosalie Phillips
Bought by
Eudy Sharon L
Home Financials for this Owner
Home Financials are based on the most recent Mortgage that was taken out on this home.
Original Mortgage
$36,700
Interest Rate
6.37%
Mortgage Type
Purchase Money Mortgage
Purchase Details
Closed on
Dec 18, 2003
Sold by
Phillips C Rosalie P and Phillips Russell P
Bought by
Phillips C Rosalie
Purchase Details
Closed on
Oct 30, 1992
Bought by
Phillips Russell P
Purchase Details
Closed on
Oct 1, 1984
Create a Home Valuation Report for This Property
The Home Valuation Report is an in-depth analysis detailing your home's value as well as a comparison with similar homes in the area
Home Values in the Area
Average Home Value in this Area
Purchase History
| Date | Buyer | Sale Price | Title Company |
|---|---|---|---|
| Chandler Robert L | $54,700 | -- | |
| Eudy Sharon L | -- | -- | |
| Phillips C Rosalie | -- | -- | |
| Phillips Russell P | -- | -- | |
| -- | $39,000 | -- |
Source: Public Records
Mortgage History
| Date | Status | Borrower | Loan Amount |
|---|---|---|---|
| Closed | Chandler Robert L | $36,700 |
Source: Public Records
Tax History
| Year | Tax Paid | Tax Assessment Tax Assessment Total Assessment is a certain percentage of the fair market value that is determined by local assessors to be the total taxable value of land and additions on the property. | Land | Improvement |
|---|---|---|---|---|
| 2025 | $591 | $22,970 | $4,730 | $18,240 |
| 2024 | $591 | $22,970 | $4,730 | $18,240 |
| 2023 | $611 | $22,960 | $4,725 | $18,235 |
| 2022 | $263 | $13,830 | $1,650 | $12,180 |
| 2021 | $264 | $13,830 | $1,650 | $12,180 |
| 2020 | $264 | $13,830 | $1,650 | $12,180 |
| 2019 | $92 | $10,260 | $1,230 | $9,030 |
| 2018 | $46 | $10,260 | $1,230 | $9,030 |
| 2017 | $92 | $10,260 | $1,230 | $9,030 |
| 2016 | $0 | $8,230 | $1,790 | $6,440 |
| 2015 | -- | $8,230 | $1,790 | $6,440 |
| 2014 | $46 | $8,230 | $1,790 | $6,440 |
| 2013 | $46 | $10,290 | $2,240 | $8,050 |
Source: Public Records
Map
Nearby Homes
- 4143 Karl Rd Unit 215
- 4143 Karl Rd Unit 314
- 4145 Karl Rd Unit 223
- 3967 Karl Rd Unit 224
- 3939 Karl Rd Unit 311
- 1130 Carbone Dr
- 1144 Reed Circle Dr
- 1863 Ward Rd
- 4320 Sandy Lane Rd
- 3750 Dresden St
- 899 Meadowview Dr
- 3620 Walmar Dr
- 4450 N 4th St
- 1242 Acton Rd
- 991 Hidden Acres Ct Unit 991
- 4800 Bourke Rd
- 4795 Colonel Perry Dr
- 3585 Gerbert Rd
- 827 Inwood Place
- 2023 Ferris Rd
- 4119 Karl Rd Unit 204C
- 4119 Karl Rd Unit C301
- 4119 Karl Rd Unit C110
- 4119 Karl Rd Unit C306
- 4119 Karl Rd Unit C308
- 4119 Karl Rd
- 4119 Karl Rd Unit C100
- 4119 Karl Rd Unit 109
- 4119 Karl Rd
- 4119 Karl Rd Unit C207
- 4119 Karl Rd
- 4119 Karl Rd
- 4119 Karl Rd
- 4119 Karl Rd Unit C307
- 4119 Karl Rd
- 4119 Karl Rd
- 4119 Karl Rd
- 4119 Karl Rd
- 4119 Karl Rd
- 4119 Karl Rd Unit C107
Your Personal Tour Guide
Ask me questions while you tour the home.