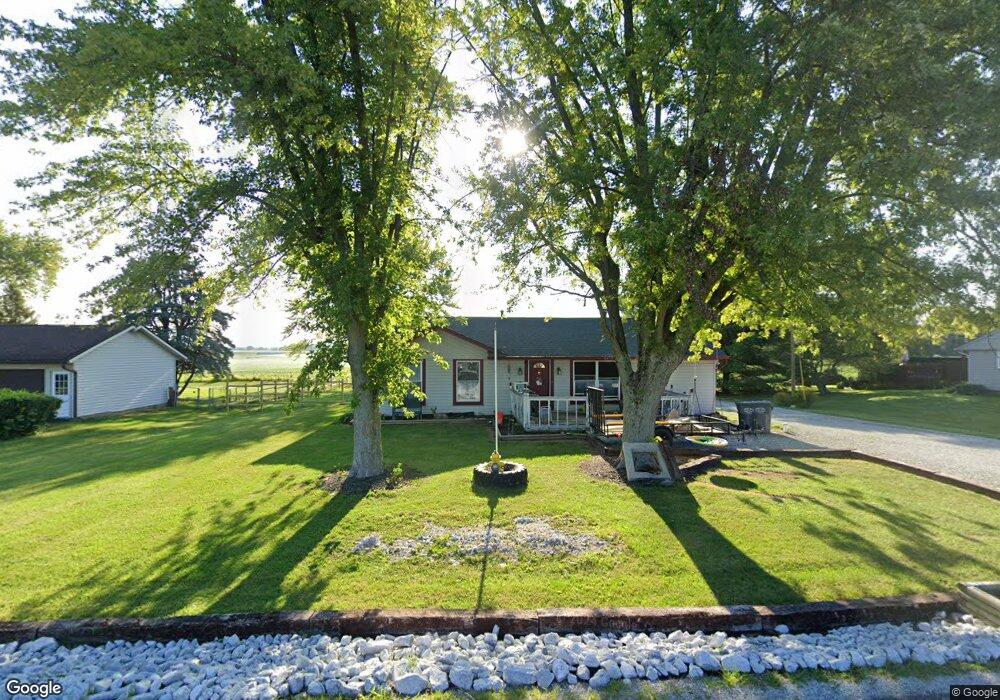
4119 N 50 E Greenfield, IN 46140
Estimated Value: $232,000 - $242,000
3
Beds
1
Bath
1,275
Sq Ft
$186/Sq Ft
Est. Value
About This Home
This home is located at 4119 N 50 E, Greenfield, IN 46140 and is currently estimated at $237,219, approximately $186 per square foot. 4119 N 50 E is a home located in Hancock County with nearby schools including Maxwell Intermediate School, Eden Elementary School, and Greenfield Central Junior High School.
Ownership History
Date
Name
Owned For
Owner Type
Purchase Details
Closed on
Jul 16, 2021
Sold by
Ballard Julia Anne and Hood Kevin
Bought by
Hood Kevin and Hood Diane
Current Estimated Value
Home Financials for this Owner
Home Financials are based on the most recent Mortgage that was taken out on this home.
Original Mortgage
$93,750
Interest Rate
2.96%
Mortgage Type
New Conventional
Purchase Details
Closed on
May 29, 2020
Sold by
Hood Julie Ann and Ballard Julie Ann
Bought by
Hood Julie Ann and Hood Kevin
Create a Home Valuation Report for This Property
The Home Valuation Report is an in-depth analysis detailing your home's value as well as a comparison with similar homes in the area
Home Values in the Area
Average Home Value in this Area
Purchase History
| Date | Buyer | Sale Price | Title Company |
|---|---|---|---|
| Hood Kevin | -- | None Available | |
| Hood Julie Ann | -- | None Available |
Source: Public Records
Mortgage History
| Date | Status | Borrower | Loan Amount |
|---|---|---|---|
| Closed | Hood Kevin | $93,750 |
Source: Public Records
Tax History
| Year | Tax Paid | Tax Assessment Tax Assessment Total Assessment is a certain percentage of the fair market value that is determined by local assessors to be the total taxable value of land and additions on the property. | Land | Improvement |
|---|---|---|---|---|
| 2024 | $2,795 | $183,800 | $44,100 | $139,700 |
| 2023 | $2,810 | $178,800 | $44,100 | $134,700 |
| 2022 | $2,009 | $130,400 | $22,000 | $108,400 |
| 2021 | $673 | $123,600 | $22,000 | $101,600 |
| 2020 | $618 | $115,700 | $22,000 | $93,700 |
| 2019 | $573 | $111,300 | $22,000 | $89,300 |
| 2018 | $640 | $117,300 | $22,000 | $95,300 |
| 2017 | $625 | $112,400 | $22,000 | $90,400 |
| 2016 | $662 | $109,800 | $21,400 | $88,400 |
| 2014 | $555 | $101,900 | $24,200 | $77,700 |
| 2013 | $555 | $103,900 | $24,200 | $79,700 |
Source: Public Records
Map
Nearby Homes
- 4045 N 50 E
- 786 E 400 N
- 852 E 400 N
- 3904 N State Road 9
- 3598 N State Road 9
- 108 S Center St
- 2374 E Water Wheel Dr
- 936 W 375 N
- 5695 N Red Oak Dr
- 100 W North St
- 6286 N 50 E
- 2367 Collins Way
- 3650 W 200 N
- 200 W 200 N
- 3513 N 300 E
- 00 Fields Blvd
- 825 W Muskegon Dr
- 5426 N 300 E
- 1581 Dale Ct
- 1761 Walnut Trace
Your Personal Tour Guide
Ask me questions while you tour the home.