Estimated Value: $442,000 - $464,000
3
Beds
2
Baths
1,827
Sq Ft
$249/Sq Ft
Est. Value
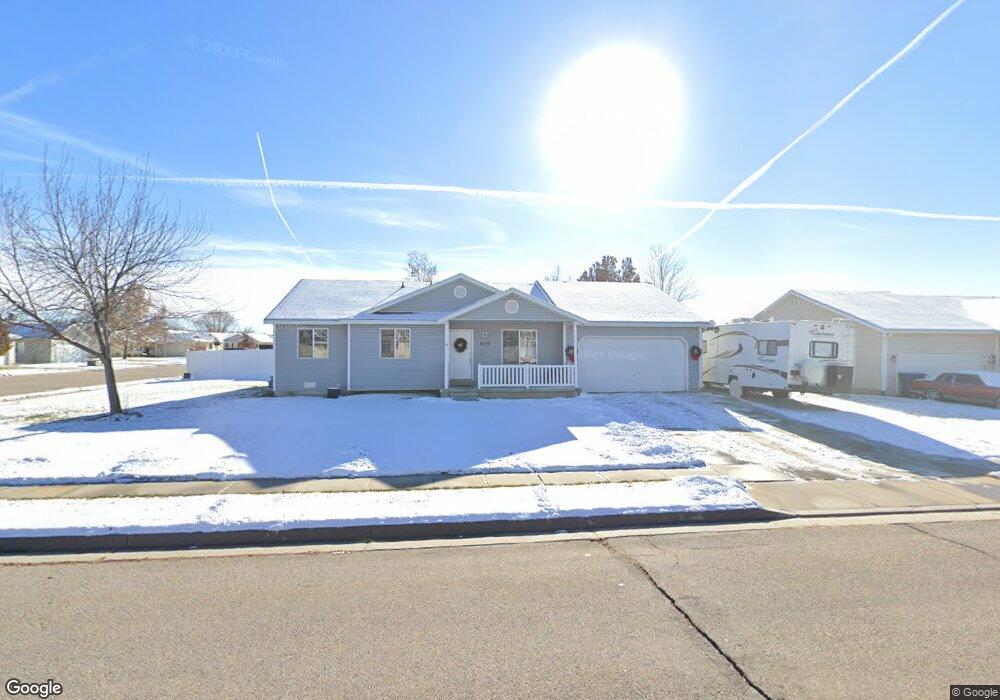
About This Home
This home is located at 4119 W 5300 S, Roy, UT 84067 and is currently estimated at $455,673, approximately $249 per square foot. 4119 W 5300 S is a home located in Weber County with nearby schools including Freedom School, Roy Junior High School, and Roy High School.
Ownership History
Date
Name
Owned For
Owner Type
Purchase Details
Closed on
Feb 17, 2022
Sold by
Jennifer Heyrend
Bought by
The Robinson Heyrend Family Trust
Current Estimated Value
Purchase Details
Closed on
Nov 23, 2021
Sold by
Lloyd David W
Bought by
Heyrend Jennifer
Purchase Details
Closed on
Dec 5, 2001
Sold by
Alpine Homes Inc
Bought by
Lloyd David W and Lloyd Kae D
Home Financials for this Owner
Home Financials are based on the most recent Mortgage that was taken out on this home.
Original Mortgage
$110,050
Interest Rate
6.15%
Create a Home Valuation Report for This Property
The Home Valuation Report is an in-depth analysis detailing your home's value as well as a comparison with similar homes in the area
Home Values in the Area
Average Home Value in this Area
Purchase History
| Date | Buyer | Sale Price | Title Company |
|---|---|---|---|
| The Robinson Heyrend Family Trust | -- | None Listed On Document | |
| Heyrend Jennifer | -- | New Title Company Name | |
| Lloyd David W | -- | First American Title Insuran |
Source: Public Records
Mortgage History
| Date | Status | Borrower | Loan Amount |
|---|---|---|---|
| Previous Owner | Lloyd David W | $110,050 |
Source: Public Records
Tax History Compared to Growth
Tax History
| Year | Tax Paid | Tax Assessment Tax Assessment Total Assessment is a certain percentage of the fair market value that is determined by local assessors to be the total taxable value of land and additions on the property. | Land | Improvement |
|---|---|---|---|---|
| 2025 | $2,812 | $449,278 | $130,241 | $319,037 |
| 2024 | $2,718 | $240,349 | $71,632 | $168,717 |
| 2023 | $2,700 | $239,800 | $67,156 | $172,644 |
| 2022 | $2,826 | $259,050 | $59,493 | $199,557 |
| 2021 | $2,203 | $330,000 | $82,313 | $247,687 |
| 2020 | $814 | $292,000 | $82,313 | $209,687 |
| 2019 | $2,030 | $263,000 | $46,848 | $216,152 |
| 2018 | $565 | $240,000 | $43,900 | $196,100 |
| 2017 | $1,831 | $209,000 | $43,900 | $165,100 |
| 2016 | $1,747 | $107,096 | $22,658 | $84,438 |
| 2015 | $1,572 | $98,154 | $22,658 | $75,496 |
| 2014 | $1,568 | $96,880 | $19,913 | $76,967 |
Source: Public Records
Map
Nearby Homes
- 5270 S 4200 W
- 5235 Midland Dr
- 5116 S 4300 W
- 4218 W 5050 S
- 5013 S 4150 W
- 4021 W 5000 S
- 5465 S 4050 W
- 4990 S 4075 W
- 4337 W 5430 S Unit A
- 4309 W 5430 St #B S
- 4342 W 5430 S Unit B
- 4890 S 4075 W
- 5539 S 4175 W
- 4141 W 4875 S
- 3766 W 5300 S
- 4449 W 5325 S
- 4106 W 4875 S
- 3820 Foxglen Dr
- 5644 S 4075 W
- 4097 W 4750 S