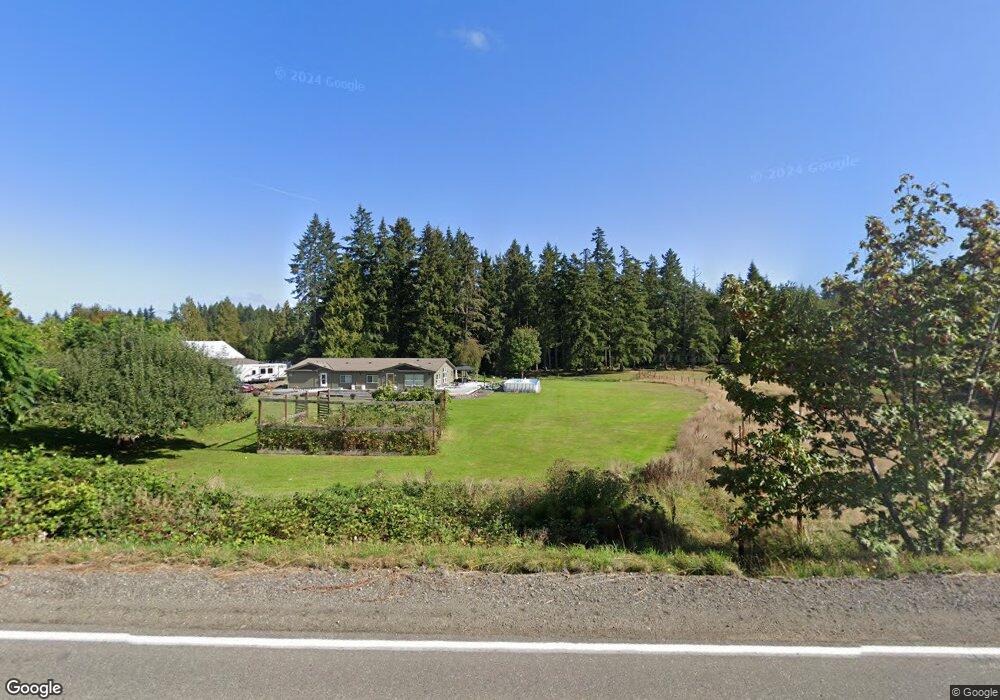
4119 Woods Rd E Port Orchard, WA 98366
Estimated Value: $795,000 - $930,000
6
Beds
2
Baths
4,056
Sq Ft
$214/Sq Ft
Est. Value
About This Home
This home is located at 4119 Woods Rd E, Port Orchard, WA 98366 and is currently estimated at $866,568, approximately $213 per square foot. 4119 Woods Rd E is a home located in Kitsap County with nearby schools including Manchester Elementary School, John Sedgwick Middle School, and South Kitsap High School.
Ownership History
Date
Name
Owned For
Owner Type
Purchase Details
Closed on
Jun 22, 2020
Sold by
Cascade Specialties Llc
Bought by
Gray Nathan and Gray Natalie
Current Estimated Value
Home Financials for this Owner
Home Financials are based on the most recent Mortgage that was taken out on this home.
Original Mortgage
$332,264
Outstanding Balance
$294,527
Interest Rate
3.2%
Mortgage Type
FHA
Estimated Equity
$572,041
Purchase Details
Closed on
Jul 15, 2015
Sold by
Dingeldine Family Trust
Bought by
Cascade Specialties Llc
Home Financials for this Owner
Home Financials are based on the most recent Mortgage that was taken out on this home.
Original Mortgage
$342,000
Interest Rate
3.85%
Mortgage Type
Seller Take Back
Purchase Details
Closed on
Sep 25, 2006
Sold by
Dingeldine George Paul and Dingeldine Mary Linda
Bought by
Dingeldine George Paul and Dingeldine Mary Linda
Create a Home Valuation Report for This Property
The Home Valuation Report is an in-depth analysis detailing your home's value as well as a comparison with similar homes in the area
Home Values in the Area
Average Home Value in this Area
Purchase History
| Date | Buyer | Sale Price | Title Company |
|---|---|---|---|
| Gray Nathan | -- | Fidelity National Title | |
| Cascade Specialties Llc | $355,000 | Land Title Co Silverdale | |
| Dingeldine George Paul | -- | None Available |
Source: Public Records
Mortgage History
| Date | Status | Borrower | Loan Amount |
|---|---|---|---|
| Open | Gray Nathan | $332,264 | |
| Previous Owner | Cascade Specialties Llc | $342,000 |
Source: Public Records
Tax History Compared to Growth
Tax History
| Year | Tax Paid | Tax Assessment Tax Assessment Total Assessment is a certain percentage of the fair market value that is determined by local assessors to be the total taxable value of land and additions on the property. | Land | Improvement |
|---|---|---|---|---|
| 2026 | $6,188 | $703,590 | $206,840 | $496,750 |
| 2025 | $6,188 | $703,590 | $206,840 | $496,750 |
| 2024 | $6,001 | $703,590 | $206,840 | $496,750 |
| 2023 | $5,958 | $703,590 | $206,840 | $496,750 |
| 2022 | $5,887 | $582,370 | $165,780 | $416,590 |
| 2021 | $5,709 | $535,120 | $157,890 | $377,230 |
| 2020 | $5,568 | $506,880 | $130,490 | $376,390 |
| 2019 | $4,802 | $479,960 | $123,060 | $356,900 |
| 2018 | $5,047 | $387,010 | $111,390 | $275,620 |
| 2017 | $4,265 | $387,010 | $111,390 | $275,620 |
| 2016 | $4,436 | $369,630 | $106,090 | $263,540 |
| 2015 | $4,837 | $410,390 | $117,250 | $293,140 |
| 2014 | -- | $350,450 | $105,740 | $244,710 |
| 2013 | -- | $350,450 | $105,740 | $244,710 |
Source: Public Records
Map
Nearby Homes
- 4611 Beach Dr E
- 4429 Waterman Ridge Ln E
- 5396 E Blaisdell Ln
- 3193 Woods Rd E
- 5675 E Hillcrest Dr
- 7021 Beach Dr E
- 7817 E Hilldale Rd
- 5172 Rich View Dr E
- 3643 Beach Dr E
- 0 Nevada Ave & Michigan St Unit NWM2365944
- 3200 Nevada East Ave
- 22 Lots Ave
- 6754 Missouri St E
- 7016 E Nightingale St
- 6997 E Bullseye St
- 3538 Beach Dr E
- 7020 E Nightingale St
- 7058 E Nightingale St
- 7057 E Bullseye St
- 7081 E Bullseye St