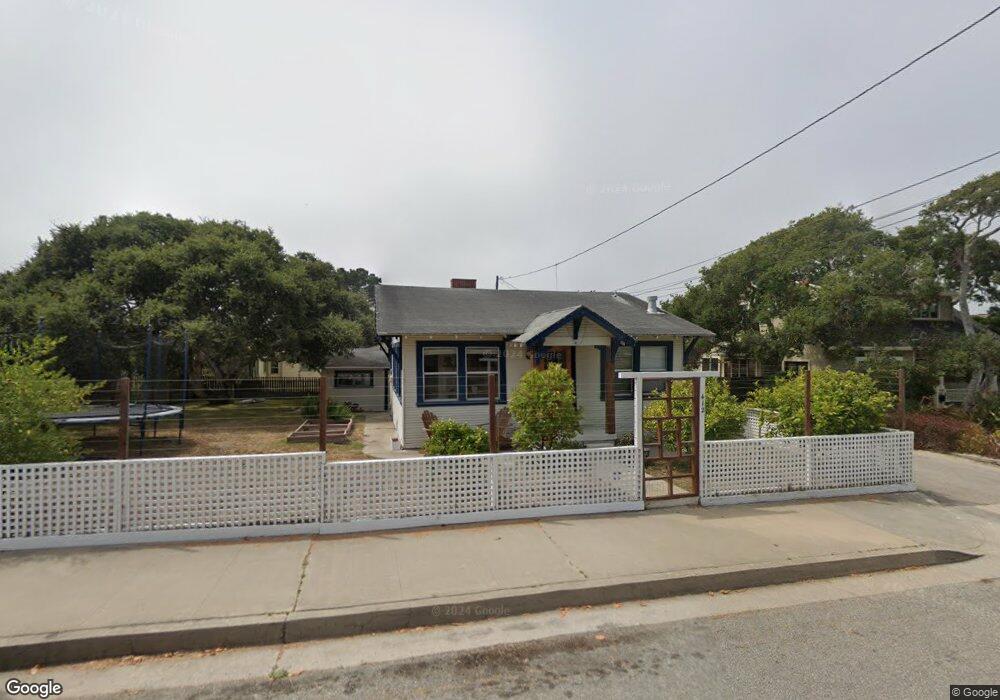
412 4th St Pacific Grove, CA 93950
Estimated Value: $955,366 - $1,352,000
2
Beds
1
Bath
790
Sq Ft
$1,480/Sq Ft
Est. Value
About This Home
This home is located at 412 4th St, Pacific Grove, CA 93950 and is currently estimated at $1,168,842, approximately $1,479 per square foot. 412 4th St is a home located in Monterey County with nearby schools including Robert Down Elementary School, Pacific Grove Middle School, and Pacific Grove High School.
Ownership History
Date
Name
Owned For
Owner Type
Purchase Details
Closed on
Dec 16, 2016
Sold by
Ichiuji Nancy Yoshiye
Bought by
Ichiuji Nancy Y and Wooding George S
Current Estimated Value
Purchase Details
Closed on
Dec 23, 2014
Sold by
Ichiuji Mary Mitsuko
Bought by
Ichiuji Nancy Yoshiye
Purchase Details
Closed on
Nov 16, 2014
Sold by
Ichiuji Nancy Yoshiye
Bought by
Ichiuji Mary Mitsuko and Nakakiyo M Ichiuji & Yoshiko E Ichiuji L
Purchase Details
Closed on
Oct 11, 2014
Sold by
Ichiuji Mary Mitsuko
Bought by
Ichiuji Nancy Yoshiye
Create a Home Valuation Report for This Property
The Home Valuation Report is an in-depth analysis detailing your home's value as well as a comparison with similar homes in the area
Home Values in the Area
Average Home Value in this Area
Purchase History
We collect this data history from publicly available records. To have your information removed, we recommend requesting removal directly through your county’s website.
| Date | Buyer | Sale Price | Title Company |
|---|---|---|---|
| Ichiuji Nancy Y | -- | None Available | |
| Ichiuji Nancy Yoshiye | -- | None Available | |
| Ichiuji Mary Mitsuko | -- | None Available | |
| Ichiuji Nancy Yoshiye | -- | None Available |
Source: Public Records
Tax History
| Year | Tax Paid | Tax Assessment Tax Assessment Total Assessment is a certain percentage of the fair market value that is determined by local assessors to be the total taxable value of land and additions on the property. | Land | Improvement |
|---|---|---|---|---|
| 2025 | $546 | $48,461 | $22,007 | $26,454 |
| 2024 | $546 | $47,512 | $21,576 | $25,936 |
| 2023 | $588 | $46,581 | $21,153 | $25,428 |
| 2022 | $577 | $45,669 | $20,739 | $24,930 |
| 2021 | $574 | $44,775 | $20,333 | $24,442 |
| 2020 | $563 | $44,317 | $20,125 | $24,192 |
| 2019 | $547 | $43,449 | $19,731 | $23,718 |
| 2018 | $539 | $42,598 | $19,345 | $23,253 |
| 2017 | $531 | $41,764 | $18,966 | $22,798 |
| 2016 | $531 | $40,946 | $18,595 | $22,351 |
| 2015 | $523 | $40,332 | $18,316 | $22,016 |
| 2014 | $513 | $39,543 | $17,958 | $21,585 |
Source: Public Records
Map
Nearby Homes
Your Personal Tour Guide
Ask me questions while you tour the home.