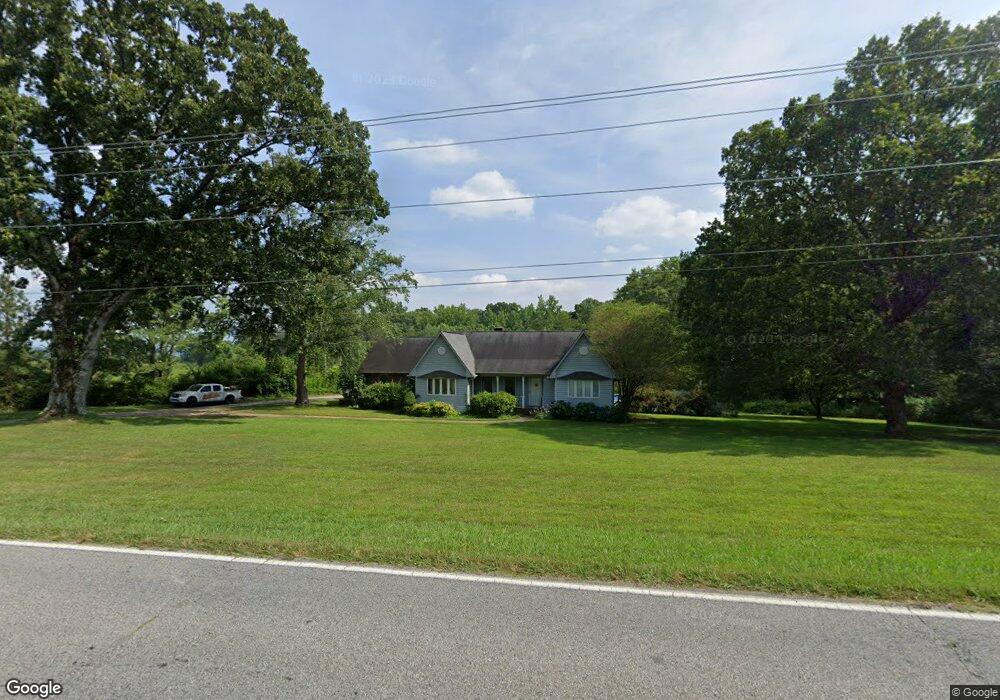
412 Borders Rd Shelby, NC 28152
Estimated Value: $319,429 - $362,000
Studio
--
Bath
1,868
Sq Ft
$184/Sq Ft
Est. Value
About This Home
This home is located at 412 Borders Rd, Shelby, NC 28152 and is currently estimated at $343,607, approximately $183 per square foot. 412 Borders Rd is a home located in Cleveland County with nearby schools including Shelby Middle School, Shelby High School, and Pinnacle Classical Academy.
Ownership History
Date
Name
Owned For
Owner Type
Purchase Details
Closed on
Jan 29, 2014
Sold by
Federal Home Loan Mortgage Corporation
Bought by
Kale Gregory Charles
Current Estimated Value
Home Financials for this Owner
Home Financials are based on the most recent Mortgage that was taken out on this home.
Original Mortgage
$118,750
Outstanding Balance
$89,512
Interest Rate
4.35%
Mortgage Type
New Conventional
Estimated Equity
$254,095
Purchase Details
Closed on
Mar 31, 2005
Sold by
Spangler James Guy and Spangler Dianne Rollins
Bought by
Suggs Roy D and Suggs Jane M
Home Financials for this Owner
Home Financials are based on the most recent Mortgage that was taken out on this home.
Original Mortgage
$35,200
Interest Rate
5.57%
Mortgage Type
Seller Take Back
Create a Home Valuation Report for This Property
The Home Valuation Report is an in-depth analysis detailing your home's value as well as a comparison with similar homes in the area
Home Values in the Area
Average Home Value in this Area
Purchase History
| Date | Buyer | Sale Price | Title Company |
|---|---|---|---|
| Kale Gregory Charles | -- | None Available | |
| Suggs Roy D | $176,000 | None Available |
Source: Public Records
Mortgage History
| Date | Status | Borrower | Loan Amount |
|---|---|---|---|
| Open | Kale Gregory Charles | $118,750 | |
| Previous Owner | Suggs Roy D | $35,200 |
Source: Public Records
Tax History
| Year | Tax Paid | Tax Assessment Tax Assessment Total Assessment is a certain percentage of the fair market value that is determined by local assessors to be the total taxable value of land and additions on the property. | Land | Improvement |
|---|---|---|---|---|
| 2025 | $2,811 | $282,514 | $35,632 | $246,882 |
| 2024 | $2,792 | $229,649 | $33,698 | $195,951 |
| 2023 | $2,784 | $229,649 | $33,698 | $195,951 |
| 2022 | $2,770 | $228,977 | $33,026 | $195,951 |
| 2021 | $2,784 | $228,977 | $33,026 | $195,951 |
| 2020 | $2,112 | $168,202 | $33,026 | $135,176 |
| 2019 | $2,112 | $168,202 | $33,026 | $135,176 |
| 2018 | $2,111 | $168,202 | $33,026 | $135,176 |
| 2017 | $2,058 | $168,202 | $33,026 | $135,176 |
| 2016 | $2,066 | $168,202 | $33,026 | $135,176 |
| 2015 | $2,141 | $183,783 | $33,026 | $150,757 |
| 2014 | $2,141 | $183,783 | $33,026 | $150,757 |
Source: Public Records
Map
Nearby Homes
- 1906 Rucker Rd
- 1904 Rucker Rd
- 313 Kellom Dr
- 0 Oates Dr
- 2111 Windermere Ln
- 357 Preyer St
- 2314 Marlowe Ave
- 2315 Marlowe Ave
- 114 Tanya Ln
- 124 Tanya Ln
- 2320 China Ave
- 2305 Holly Ln
- 2021 Dogwood Trail
- 2016 Dogwood Trail
- 2404 Eleanor Dr
- 2207 Peninsula Ave
- 0 Pinecrest Dr
- 1406 S Post Rd
- 1206 Borders Rd
- 123 Pinecrest Dr
Your Personal Tour Guide
Ask me questions while you tour the home.