Estimated Value: $162,000 - $193,000
--
Bed
1
Bath
1,258
Sq Ft
$143/Sq Ft
Est. Value
About This Home
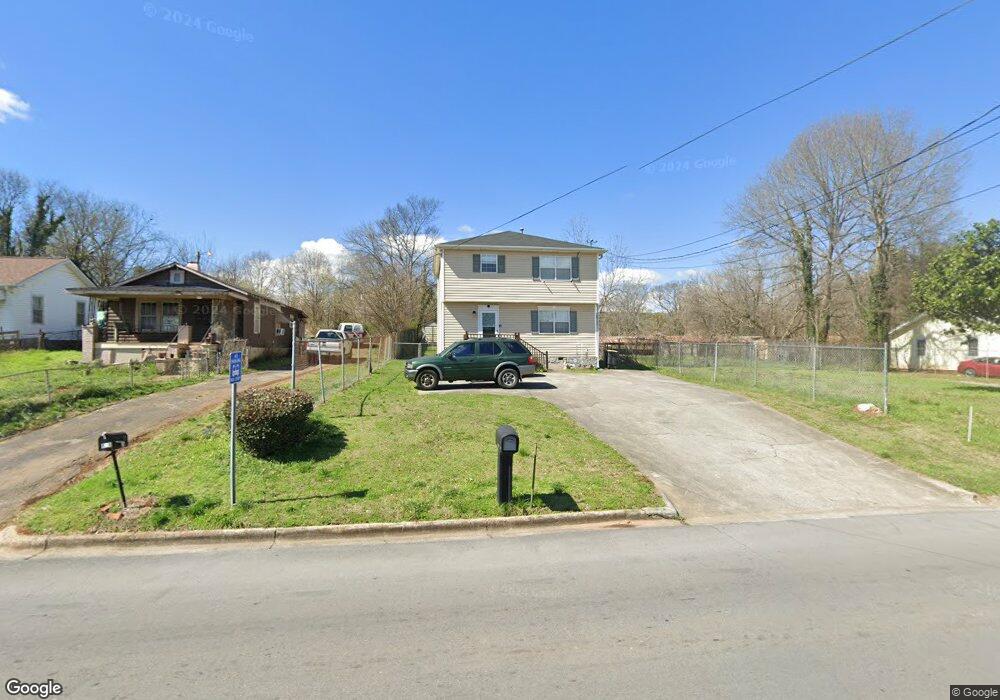
This home is located at 412 Cedar Ave SW, Rome, GA 30161 and is currently estimated at $180,063, approximately $143 per square foot. 412 Cedar Ave SW is a home located in Floyd County with nearby schools including Dan McCarty Middle School, Rome High School, and Darlington School.
Ownership History
Date
Name
Owned For
Owner Type
Purchase Details
Closed on
Aug 27, 2025
Sold by
Barton Calvin B
Bought by
Adcox Janie and Barton Calvin B
Current Estimated Value
Purchase Details
Closed on
Jan 18, 2012
Bought by
Barton Calvin B
Purchase Details
Closed on
Sep 6, 2011
Sold by
Wells Fargo Bank
Bought by
Secretary Of Housing
Purchase Details
Closed on
Jan 25, 2002
Sold by
Creamer Shonna
Bought by
Dean Shonna
Purchase Details
Closed on
Aug 15, 2000
Sold by
Evans Grading Company Inc
Bought by
Creamer Shonna
Purchase Details
Closed on
Sep 18, 1995
Sold by
Smith Evans Lumber Company
Bought by
Evans Grading Company Inc
Purchase Details
Closed on
Nov 5, 1979
Bought by
P and R
Purchase Details
Closed on
May 23, 1979
Bought by
P and R
Purchase Details
Closed on
Dec 18, 1963
Sold by
Daniel Mather D
Bought by
Cave Joseph D
Purchase Details
Closed on
Aug 22, 1963
Sold by
Wallace Jl
Bought by
Daniel Mather D
Purchase Details
Closed on
Jan 1, 1901
Bought by
Wallace Jl
Create a Home Valuation Report for This Property
The Home Valuation Report is an in-depth analysis detailing your home's value as well as a comparison with similar homes in the area
Home Values in the Area
Average Home Value in this Area
Purchase History
| Date | Buyer | Sale Price | Title Company |
|---|---|---|---|
| Adcox Janie | -- | -- | |
| Barton Calvin B | $29,700 | -- | |
| Secretary Of Housing | $53,013 | -- | |
| Wells Fargo Bank | $58,726 | -- | |
| Dean Shonna | -- | -- | |
| Creamer Shonna | -- | -- | |
| Evans Grading Company Inc | $19,800 | -- | |
| P | -- | -- | |
| P | $24,000 | -- | |
| Smith Evans Lumber Company | $25,000 | -- | |
| Riddle Gh | -- | -- | |
| Cave Sarah T | -- | -- | |
| Cave Joseph D | $6,500 | -- | |
| Daniel Mather D | -- | -- | |
| Wallace Jl | -- | -- |
Source: Public Records
Tax History Compared to Growth
Tax History
| Year | Tax Paid | Tax Assessment Tax Assessment Total Assessment is a certain percentage of the fair market value that is determined by local assessors to be the total taxable value of land and additions on the property. | Land | Improvement |
|---|---|---|---|---|
| 2024 | $2,232 | $68,076 | $4,988 | $63,088 |
| 2023 | $1,424 | $40,541 | $4,534 | $36,007 |
| 2022 | $1,222 | $33,491 | $3,628 | $29,863 |
| 2021 | $1,134 | $30,552 | $3,628 | $26,924 |
| 2020 | $1,063 | $28,402 | $2,834 | $25,568 |
| 2019 | $1,000 | $27,003 | $2,834 | $24,169 |
| 2018 | $947 | $25,592 | $2,834 | $22,758 |
| 2017 | $919 | $24,812 | $2,834 | $21,978 |
| 2016 | $907 | $24,434 | $2,800 | $21,634 |
| 2015 | $417 | $24,434 | $2,800 | $21,634 |
| 2014 | $417 | $24,434 | $2,800 | $21,634 |
Source: Public Records
Map
Nearby Homes
- 1901 Hull Ave SW
- 106 E 14th St SW
- 000 E Oglethorpe Hwy
- 39 E 16th St SW
- 304 E 19th St SW
- 316 S McLin St SW
- 1502 Spring Creek St SW
- 2014 Maple Ave SW
- 1705 Olmstead St SW
- 4 E 15th St SW
- 414 E 17th St SW
- 14 Clover St SW
- 164 E 11th St SE
- 2108 Maple Ave SW
- 168 E 11th St SE
- 170 E 11th St SW
- 166 E 11th St SW
- 162 E 11th St SE
- 412 Cedar Ave SW
- 414 Cedar Ave SW
- 416 Cedar Ave SW
- 408 Cedar Ave SW
- 418 Cedar Ave SW
- 413 Cedar Ave SW
- 415 Cedar Ave SW
- 420 Cedar Ave SW
- 417 Cedar Ave SW
- 417 Cedar Ave SW
- 402 Cedar Ave SW
- 424 Cedar Ave SW
- 2 E 18th St SW
- 421 Cedar Ave SW
- 421 Cedar Ave SW
- 421 Cedar Ave SW
- 34 Higgins St SW
- 9 E 18th St SW
- 0 Higgins St
- 104 Crescent Ave SW