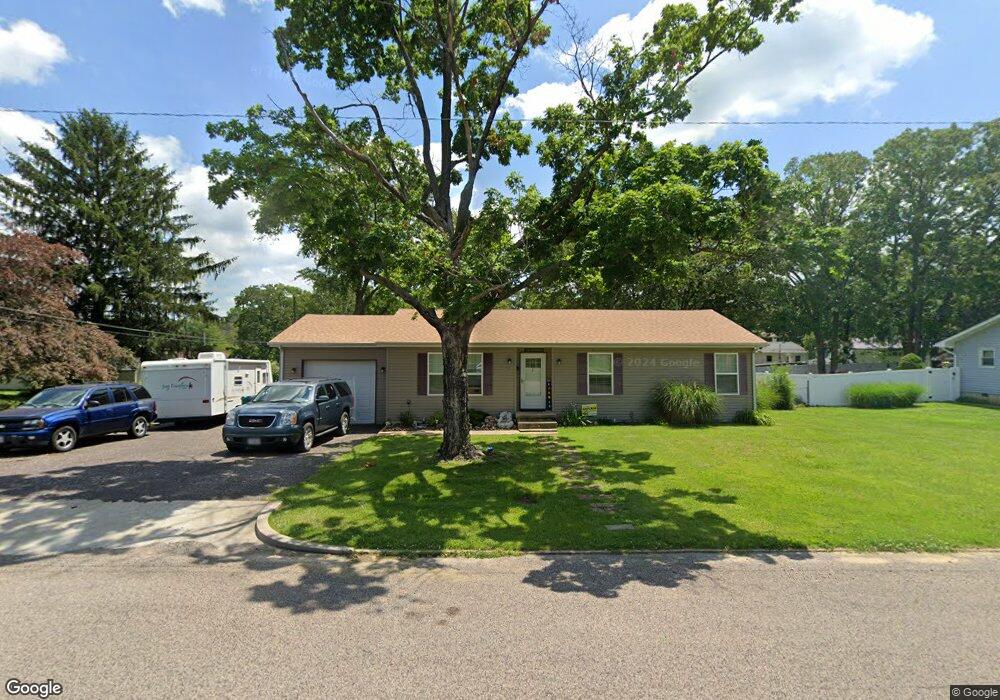
412 Cherry St Sullivan, MO 63080
Estimated Value: $154,000 - $166,971
3
Beds
1
Bath
1,180
Sq Ft
$136/Sq Ft
Est. Value
About This Home
This home is located at 412 Cherry St, Sullivan, MO 63080 and is currently estimated at $160,657, approximately $136 per square foot. 412 Cherry St is a home located in Franklin County with nearby schools including Sullivan Primary School, Sullivan Elementary School, and Sullivan Middle School.
Ownership History
Date
Name
Owned For
Owner Type
Purchase Details
Closed on
Dec 14, 2015
Sold by
Franklin Financial Corp
Bought by
Thoms Anthony W and Thoms Christine K
Current Estimated Value
Purchase Details
Closed on
Dec 20, 2012
Sold by
Woodham Mitch A and Woodham Mary D
Bought by
Franklin Financial Corp
Purchase Details
Closed on
Jan 20, 2010
Sold by
Woodham Mitch A and Woodham Mary D
Bought by
Loveless John B
Purchase Details
Closed on
Dec 28, 2009
Sold by
Buerk Kent E
Bought by
Franklin Financial Corp
Purchase Details
Closed on
Nov 21, 2007
Sold by
Reed Kurtis and Lambing Stephanle
Bought by
Buerk Kent E
Home Financials for this Owner
Home Financials are based on the most recent Mortgage that was taken out on this home.
Original Mortgage
$92,857
Interest Rate
6.42%
Mortgage Type
New Conventional
Purchase Details
Closed on
May 10, 2007
Sold by
Tucker Rose A
Bought by
Reed Kurtis and Lambing Stephanie
Home Financials for this Owner
Home Financials are based on the most recent Mortgage that was taken out on this home.
Original Mortgage
$75,850
Interest Rate
6.13%
Mortgage Type
New Conventional
Create a Home Valuation Report for This Property
The Home Valuation Report is an in-depth analysis detailing your home's value as well as a comparison with similar homes in the area
Home Values in the Area
Average Home Value in this Area
Purchase History
| Date | Buyer | Sale Price | Title Company |
|---|---|---|---|
| Thoms Anthony W | $79,900 | -- | |
| Franklin Financial Corp | -- | None Available | |
| Loveless John B | -- | None Available | |
| Woodham Mitch A | -- | None Available | |
| Franklin Financial Corp | $44,126 | None Available | |
| Buerk Kent E | -- | None Available | |
| Reed Kurtis | -- | None Available |
Source: Public Records
Mortgage History
| Date | Status | Borrower | Loan Amount |
|---|---|---|---|
| Previous Owner | Buerk Kent E | $92,857 | |
| Previous Owner | Reed Kurtis | $75,850 | |
| Closed | Thoms Anthony W | $0 |
Source: Public Records
Tax History
| Year | Tax Paid | Tax Assessment Tax Assessment Total Assessment is a certain percentage of the fair market value that is determined by local assessors to be the total taxable value of land and additions on the property. | Land | Improvement |
|---|---|---|---|---|
| 2025 | $1,293 | $20,889 | $0 | $0 |
| 2024 | $1,293 | $19,580 | $0 | $0 |
| 2023 | $1,138 | $19,169 | $0 | $0 |
| 2022 | $1,019 | $17,573 | $0 | $0 |
| 2021 | $1,025 | $17,573 | $0 | $0 |
| 2020 | $958 | $16,116 | $0 | $0 |
| 2019 | $959 | $16,116 | $0 | $0 |
| 2018 | $905 | $15,016 | $0 | $0 |
| 2017 | $913 | $15,016 | $0 | $0 |
| 2016 | $895 | $14,892 | $0 | $0 |
| 2015 | $897 | $14,892 | $0 | $0 |
| 2014 | $878 | $15,042 | $0 | $0 |
Source: Public Records
Map
Nearby Homes
Your Personal Tour Guide
Ask me questions while you tour the home.