Estimated Value: $142,244 - $177,000
3
Beds
1
Bath
1,408
Sq Ft
$117/Sq Ft
Est. Value
About This Home
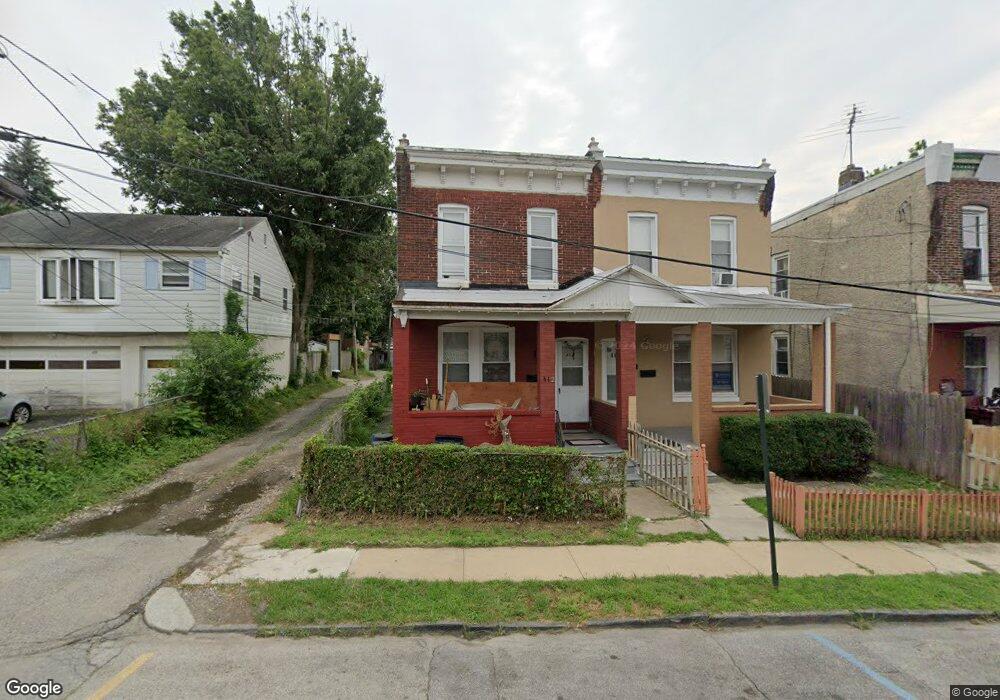
This home is located at 412 Chestnut St, Darby, PA 19023 and is currently estimated at $164,311, approximately $116 per square foot. 412 Chestnut St is a home located in Delaware County with nearby schools including Walnut Street Elementary School, Penn Wood Middle School, and Penn Wood High School - Cypress Street Campus.
Ownership History
Date
Name
Owned For
Owner Type
Purchase Details
Closed on
Oct 20, 2000
Sold by
Hearon Harry E
Bought by
Dixon Myra D and Dixon George A
Current Estimated Value
Home Financials for this Owner
Home Financials are based on the most recent Mortgage that was taken out on this home.
Original Mortgage
$51,300
Outstanding Balance
$18,588
Interest Rate
7.83%
Mortgage Type
Purchase Money Mortgage
Estimated Equity
$145,723
Purchase Details
Closed on
Feb 22, 1999
Sold by
Security National Partners Lp
Bought by
Hearon Harry E
Purchase Details
Closed on
Sep 13, 1996
Sold by
Bair Gerald J and Bair Theresa R
Bought by
Security National Partners Lp
Create a Home Valuation Report for This Property
The Home Valuation Report is an in-depth analysis detailing your home's value as well as a comparison with similar homes in the area
Home Values in the Area
Average Home Value in this Area
Purchase History
| Date | Buyer | Sale Price | Title Company |
|---|---|---|---|
| Dixon Myra D | $54,000 | -- | |
| Hearon Harry E | $12,900 | -- | |
| Security National Partners Lp | -- | -- |
Source: Public Records
Mortgage History
| Date | Status | Borrower | Loan Amount |
|---|---|---|---|
| Open | Dixon Myra D | $51,300 |
Source: Public Records
Tax History Compared to Growth
Tax History
| Year | Tax Paid | Tax Assessment Tax Assessment Total Assessment is a certain percentage of the fair market value that is determined by local assessors to be the total taxable value of land and additions on the property. | Land | Improvement |
|---|---|---|---|---|
| 2025 | $3,005 | $60,690 | $14,270 | $46,420 |
| 2024 | $3,005 | $60,690 | $14,270 | $46,420 |
| 2023 | $2,827 | $60,690 | $14,270 | $46,420 |
| 2022 | $2,750 | $60,690 | $14,270 | $46,420 |
| 2021 | $3,838 | $60,690 | $14,270 | $46,420 |
| 2020 | $3,444 | $47,150 | $13,530 | $33,620 |
| 2019 | $3,298 | $47,150 | $13,530 | $33,620 |
| 2018 | $3,258 | $47,150 | $0 | $0 |
| 2017 | $3,198 | $47,150 | $0 | $0 |
| 2016 | $259 | $47,150 | $0 | $0 |
| 2015 | $259 | $47,150 | $0 | $0 |
| 2014 | $259 | $47,150 | $0 | $0 |
Source: Public Records
Map
Nearby Homes