412 Collyer St Longmont, CO 80501
Kensington NeighborhoodEstimated Value: $455,000 - $498,000
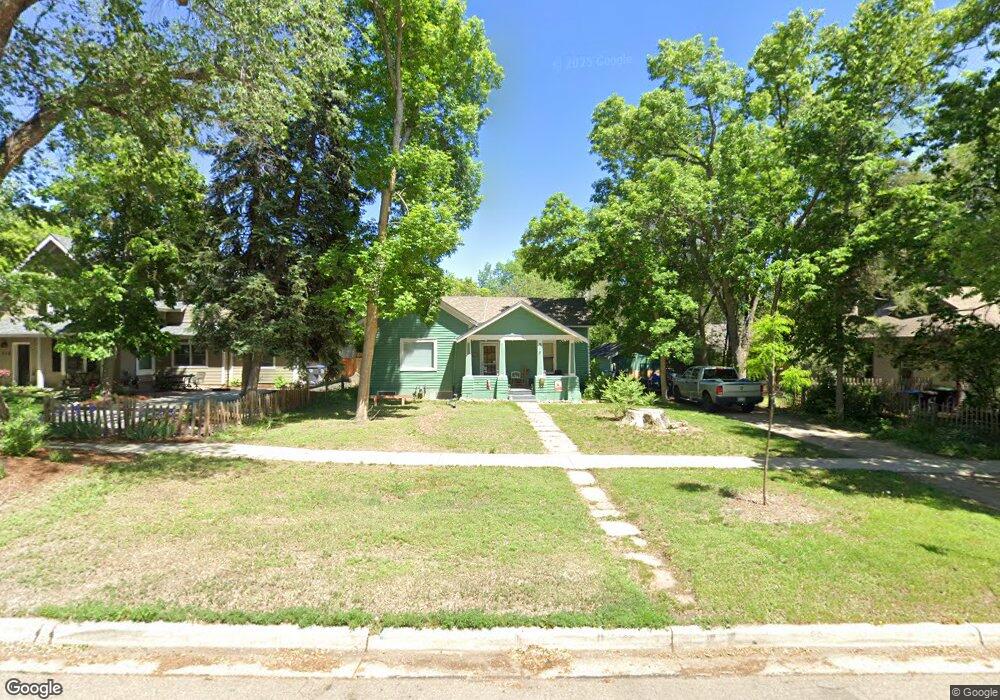
About This Home
This home is located at 412 Collyer St, Longmont, CO 80501 and is currently estimated at $475,170, approximately $415 per square foot. 412 Collyer St is a home located in Boulder County with nearby schools including Columbine Elementary School, Trail Ridge Middle School, and Skyline High School.
Ownership History
We collect this data history from publicly available records. To have your information removed, we recommend requesting removal directly through your county’s website.
Purchase Details
Purchase Details
Purchase Details
Purchase Details
Home Values in the Area
Average Home Value in this Area
Purchase History
We collect this data history from publicly available records. To have your information removed, we recommend requesting removal directly through your county’s website.
| Date | Buyer | Sale Price | Title Company |
|---|---|---|---|
| -- | None Available | ||
| -- | None Available | ||
| $118,000 | Land Title | ||
| -- | -- |
Tax History
We collect this data history from publicly available records. To have your information removed, we recommend requesting removal directly through your county’s website.
| Year | Tax Paid | Tax Assessment Tax Assessment Total Assessment is a certain percentage of the fair market value that is determined by local assessors to be the total taxable value of land and additions on the property. | Land | Improvement |
|---|---|---|---|---|
| 2026 | $3,089 | $32,015 | $12,594 | $19,421 |
| 2025 | $3,089 | $32,015 | $12,594 | $19,421 |
| 2024 | $2,603 | $29,425 | $11,575 | $17,850 |
| 2023 | $2,568 | $27,215 | $12,201 | $18,700 |
| 2022 | $2,261 | $22,851 | $9,118 | $13,733 |
| 2021 | $2,291 | $23,509 | $9,381 | $14,128 |
| 2020 | $2,142 | $22,051 | $10,296 | $11,755 |
| 2019 | $2,108 | $22,051 | $10,296 | $11,755 |
| 2018 | $1,914 | $20,153 | $10,728 | $9,425 |
| 2017 | $1,888 | $22,280 | $11,860 | $10,420 |
| 2016 | $1,481 | $15,490 | $8,756 | $6,734 |
| 2015 | $1,411 | $14,646 | $6,686 | $7,960 |
| 2014 | $1,368 | $14,646 | $6,686 | $7,960 |
Map
- 348 Collyer St Unit 208
- 400 Emery St Unit 103
- 422 Atwood St
- 443 Baker St
- 414 4th Ave
- 12 Marshall Place
- 613 Martin St
- 700 Darby Ct
- 36 Reed Place
- 706 Darby Ct
- 729 Atwood St
- 401 Terry St Unit F
- 433 Sunnyside Ln
- 858 3rd Ave
- 814 Baker St
- 127 E Saint Clair Ave
- 820 Kimbark St Unit B
- 226 Pratt St Unit 226
- 255 Pratt St
- 830 Martin St
Ask me questions while you tour the home.