Estimated Value: $287,000 - $303,000
3
Beds
2
Baths
1,384
Sq Ft
$210/Sq Ft
Est. Value
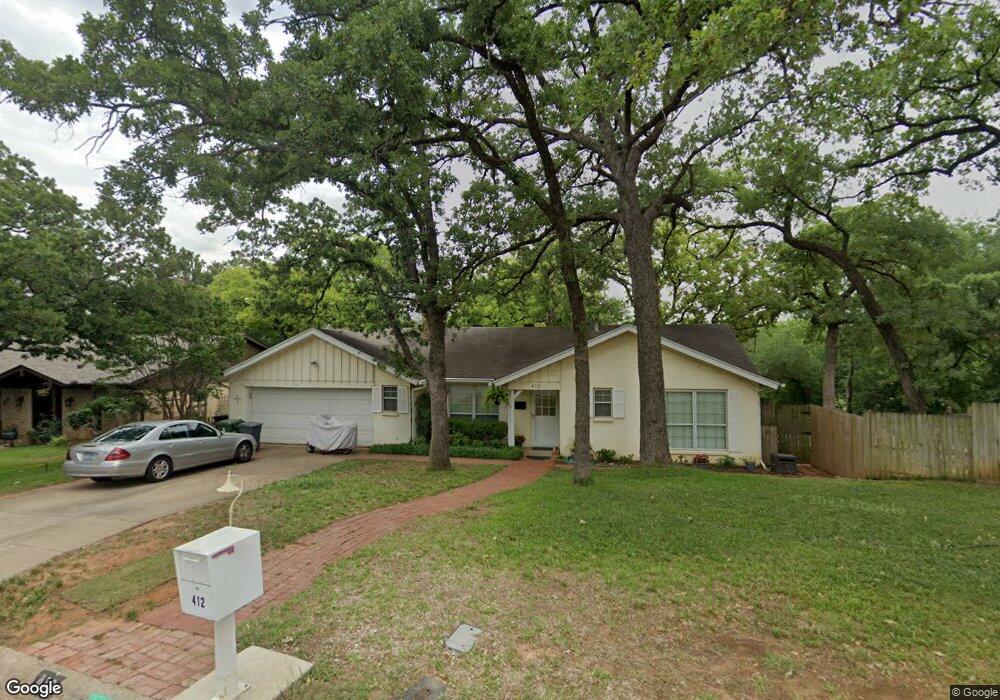
About This Home
This home is located at 412 Crosstimber Dr, Hurst, TX 76053 and is currently estimated at $291,284, approximately $210 per square foot. 412 Crosstimber Dr is a home located in Tarrant County with nearby schools including West Hurst Elementary School, Hurst J High School, and L.D. Bell High School.
Ownership History
Date
Name
Owned For
Owner Type
Purchase Details
Closed on
Oct 15, 2004
Sold by
Nelson George Ellsworth and Nelson Gloria Dunbar
Bought by
Lankenau John and Lankenau Claudia
Current Estimated Value
Home Financials for this Owner
Home Financials are based on the most recent Mortgage that was taken out on this home.
Original Mortgage
$96,000
Outstanding Balance
$47,703
Interest Rate
5.82%
Mortgage Type
Purchase Money Mortgage
Estimated Equity
$243,581
Purchase Details
Closed on
Jan 26, 2001
Sold by
Childs Randall R and Foster Debra Kay
Bought by
Nelson George Ellsworth and Dunbar Gloria Lee
Home Financials for this Owner
Home Financials are based on the most recent Mortgage that was taken out on this home.
Original Mortgage
$76,000
Interest Rate
7.21%
Purchase Details
Closed on
Mar 15, 1994
Sold by
Livens Stephen J
Bought by
Childs Randall
Create a Home Valuation Report for This Property
The Home Valuation Report is an in-depth analysis detailing your home's value as well as a comparison with similar homes in the area
Home Values in the Area
Average Home Value in this Area
Purchase History
| Date | Buyer | Sale Price | Title Company |
|---|---|---|---|
| Lankenau John | -- | First Land Title | |
| Nelson George Ellsworth | -- | Fidelity National Title | |
| Childs Randall | -- | -- | |
| Childs Randall | -- | -- | |
| Childs Randall | -- | -- |
Source: Public Records
Mortgage History
| Date | Status | Borrower | Loan Amount |
|---|---|---|---|
| Open | Lankenau John | $96,000 | |
| Previous Owner | Nelson George Ellsworth | $76,000 | |
| Closed | Nelson George Ellsworth | $19,000 | |
| Closed | Lankenau John | $18,000 |
Source: Public Records
Tax History
| Year | Tax Paid | Tax Assessment Tax Assessment Total Assessment is a certain percentage of the fair market value that is determined by local assessors to be the total taxable value of land and additions on the property. | Land | Improvement |
|---|---|---|---|---|
| 2025 | $995 | $215,384 | $71,250 | $144,134 |
| 2024 | $995 | $215,384 | $71,250 | $144,134 |
| 2023 | $995 | $204,060 | $35,625 | $168,435 |
| 2022 | $4,004 | $173,887 | $35,625 | $138,262 |
| 2021 | $3,829 | $158,750 | $35,625 | $123,125 |
| 2020 | $3,520 | $170,092 | $35,625 | $134,467 |
| 2019 | $3,255 | $133,000 | $36,000 | $97,000 |
| 2018 | $2,719 | $133,000 | $21,599 | $111,401 |
| 2017 | $3,696 | $153,883 | $22,500 | $131,383 |
| 2016 | $3,360 | $135,455 | $22,500 | $112,955 |
| 2015 | $2,744 | $120,700 | $22,500 | $98,200 |
| 2014 | $2,744 | $120,700 | $22,500 | $98,200 |
Source: Public Records
Map
Nearby Homes
- 608 W Redbud Dr
- 408 Simmons Dr
- 416 Simmons Dr
- 637 Post Oak Dr
- 528 Buena Vista Dr
- 756 Briarwood Ln
- 758 Briarwood Ln
- 709 Hurstview Dr
- 780 Betty Ln
- 712 Pine St
- 800 Treadwell Ct Unit 800B
- 808 Betty Ct
- 47 Donald Ct
- 231 Elm St
- 852 W Redbud Dr
- 205 Corinna Ct
- 552 Norwood Dr
- 609 Norwood Dr
- 701 Harrison Ln
- 424 Holder Dr
- 416 Crosstimber Dr
- 404 Crosstimber Dr
- 420 Crosstimber Dr
- 413 Crosstimber Dr
- 405 Crosstimber Dr
- 400 Crosstimber Dr
- 421 Crosstimber Dr
- 424 Crosstimber Dr
- 609 Woodside Dr
- 104 Crosstimber Ct
- 324 Crosstimber Dr
- 425 Crosstimber Dr
- 325 Crosstimber Dr
- 608 Woodside Dr
- 613 Woodside Dr
- 430 Crosstimber Dr
- 105 Crosstimber Ct
- 108 Crosstimber Ct
- 612 Woodside Dr
- 320 Crosstimber Dr
Your Personal Tour Guide
Ask me questions while you tour the home.