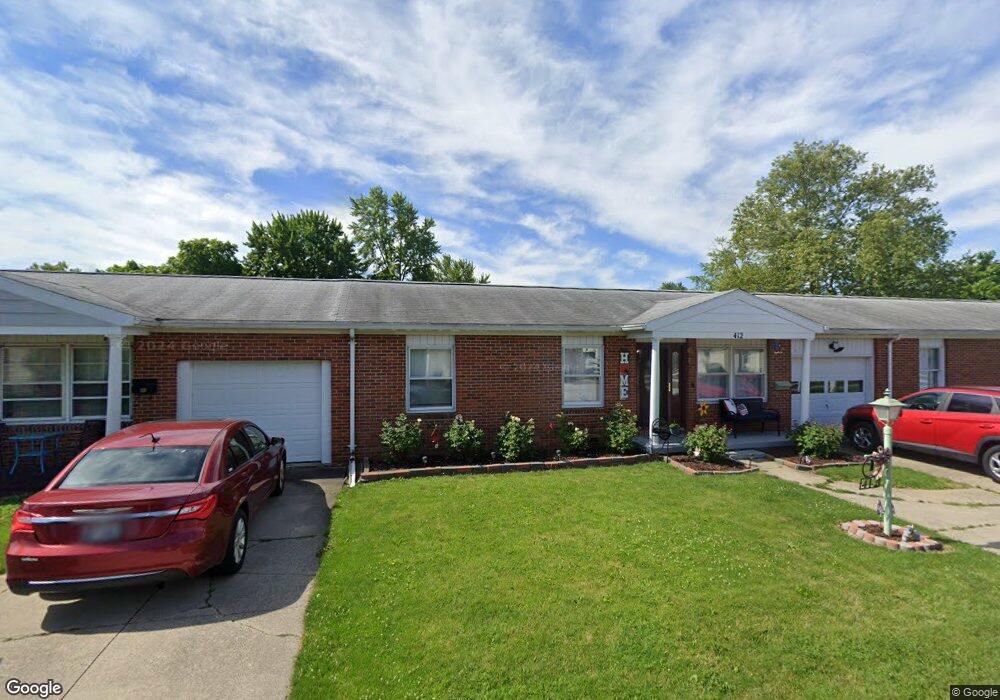
412 Culbertson Ln Fostoria, OH 44830
Estimated Value: $68,733 - $110,000
2
Beds
1
Bath
900
Sq Ft
$102/Sq Ft
Est. Value
About This Home
This home is located at 412 Culbertson Ln, Fostoria, OH 44830 and is currently estimated at $91,683, approximately $101 per square foot. 412 Culbertson Ln is a home located in Seneca County with nearby schools including Fostoria Intermediate Elementary School and Fostoria Junior/Senior High School.
Ownership History
Date
Name
Owned For
Owner Type
Purchase Details
Closed on
May 9, 2019
Sold by
Olmstead Dennis R and Olmstead Robert L
Bought by
Thompson Amy
Current Estimated Value
Home Financials for this Owner
Home Financials are based on the most recent Mortgage that was taken out on this home.
Original Mortgage
$50,320
Outstanding Balance
$44,061
Interest Rate
4%
Mortgage Type
New Conventional
Estimated Equity
$47,622
Purchase Details
Closed on
Feb 28, 2005
Sold by
Smith Janice E
Bought by
Olmstead Leo J and Olmstead Nina P
Purchase Details
Closed on
Jul 8, 1998
Sold by
Stull Marilyn V
Bought by
Smith Janice E
Purchase Details
Closed on
Sep 1, 1988
Purchase Details
Closed on
Jul 1, 1985
Create a Home Valuation Report for This Property
The Home Valuation Report is an in-depth analysis detailing your home's value as well as a comparison with similar homes in the area
Home Values in the Area
Average Home Value in this Area
Purchase History
| Date | Buyer | Sale Price | Title Company |
|---|---|---|---|
| Thompson Amy | $62,900 | Mid American Title Agcy Inc | |
| Olmstead Leo J | $65,000 | Heartland Title | |
| Smith Janice E | $36,000 | -- | |
| -- | $55,000 | -- | |
| -- | $48,000 | -- |
Source: Public Records
Mortgage History
| Date | Status | Borrower | Loan Amount |
|---|---|---|---|
| Open | Thompson Amy | $50,320 |
Source: Public Records
Tax History Compared to Growth
Tax History
| Year | Tax Paid | Tax Assessment Tax Assessment Total Assessment is a certain percentage of the fair market value that is determined by local assessors to be the total taxable value of land and additions on the property. | Land | Improvement |
|---|---|---|---|---|
| 2024 | $929 | $18,460 | $1,550 | $16,910 |
| 2023 | $931 | $18,460 | $1,550 | $16,910 |
| 2022 | $835 | $14,760 | $1,330 | $13,430 |
| 2021 | $854 | $14,760 | $1,330 | $13,430 |
| 2020 | $857 | $14,767 | $1,334 | $13,433 |
| 2019 | $834 | $14,252 | $1,288 | $12,964 |
| 2018 | $328 | $14,252 | $1,288 | $12,964 |
| 2017 | $328 | $14,252 | $1,288 | $12,964 |
| 2016 | $642 | $20,804 | $1,421 | $19,383 |
| 2015 | $631 | $20,804 | $1,421 | $19,383 |
| 2014 | $600 | $20,804 | $1,421 | $19,383 |
| 2013 | $748 | $22,614 | $1,547 | $21,067 |
Source: Public Records
Map
Nearby Homes
- 900 N Countyline St
- 892 N Countyline St
- 1324 N Union St
- 375 Thomas St
- 931 N Union St
- 901 Central Ave
- 723 N Union St
- 727 Eisenhower Dr
- 633 Maple St
- 520 N Union St
- 540 N Poplar St
- 827 Buckley St
- 220 E High St
- 509 College Ave
- 203 N Union St
- 711 Circle Dr
- 348 W South St
- 634 W Tiffin St
- 481 Beverly Dr
- 351 W South St
- 408 Culbertson Ln
- 426 W Culbertson St
- 423 Ash St
- 435 Ash St
- 416 W Culbertson St
- 416 Culbertson Ln
- 414 Culbertson St
- 441 Ash St
- 412 W Culbertson St
- 410 W Culbertson St
- 408 W Culbertson St
- 411 Ash St
- 445 Ash St
- 445 Ash St
- 432 Ash St
- 501 Culbertson St
- 421 W Culbertson St
- 501 W Culbertson St
- 406 W Culbertson St
- 424 Ash St