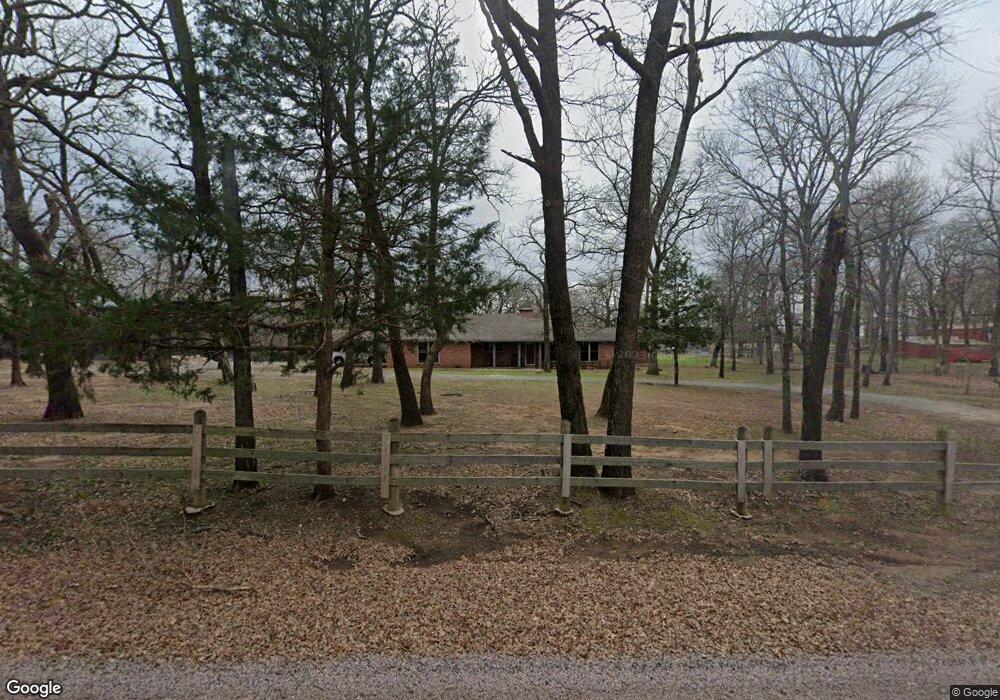
412 Darryl Dr Denison, TX 75021
Estimated Value: $404,545 - $573,000
3
Beds
2
Baths
2,287
Sq Ft
$215/Sq Ft
Est. Value
About This Home
This home is located at 412 Darryl Dr, Denison, TX 75021 and is currently estimated at $492,636, approximately $215 per square foot. 412 Darryl Dr is a home located in Grayson County with nearby schools including Bells Elementary School, Pritchard Junior High School, and Bells High School.
Ownership History
Date
Name
Owned For
Owner Type
Purchase Details
Closed on
Dec 21, 2020
Sold by
Salcedo Cesar
Bought by
Smith Kellie Renea and Smith Randall L
Current Estimated Value
Home Financials for this Owner
Home Financials are based on the most recent Mortgage that was taken out on this home.
Original Mortgage
$315,000
Outstanding Balance
$280,944
Interest Rate
2.8%
Mortgage Type
New Conventional
Estimated Equity
$211,692
Purchase Details
Closed on
Oct 11, 2019
Sold by
Neasbitt Jim
Bought by
Salcedo Joshua M and Neasbitt Jamie R
Purchase Details
Closed on
Dec 16, 2011
Sold by
Cathey Leslie and Fleitman Leslie
Bought by
Salcedo Cesar
Home Financials for this Owner
Home Financials are based on the most recent Mortgage that was taken out on this home.
Original Mortgage
$146,938
Interest Rate
4.03%
Mortgage Type
New Conventional
Purchase Details
Closed on
Jul 7, 2011
Sold by
Fleitman Alvin B
Bought by
Fleitman Leslie
Home Financials for this Owner
Home Financials are based on the most recent Mortgage that was taken out on this home.
Original Mortgage
$80,400
Interest Rate
4.03%
Mortgage Type
Unknown
Create a Home Valuation Report for This Property
The Home Valuation Report is an in-depth analysis detailing your home's value as well as a comparison with similar homes in the area
Home Values in the Area
Average Home Value in this Area
Purchase History
| Date | Buyer | Sale Price | Title Company |
|---|---|---|---|
| Smith Kellie Renea | -- | Chicago Title | |
| Salcedo Joshua M | -- | None Available | |
| Salcedo Cesar | -- | Chapin Title Co Inc | |
| Fleitman Leslie | -- | Chapin Title Co Inc |
Source: Public Records
Mortgage History
| Date | Status | Borrower | Loan Amount |
|---|---|---|---|
| Open | Smith Kellie Renea | $315,000 | |
| Previous Owner | Salcedo Cesar | $146,938 | |
| Previous Owner | Fleitman Leslie | $80,400 |
Source: Public Records
Tax History
| Year | Tax Paid | Tax Assessment Tax Assessment Total Assessment is a certain percentage of the fair market value that is determined by local assessors to be the total taxable value of land and additions on the property. | Land | Improvement |
|---|---|---|---|---|
| 2025 | $5,974 | $466,353 | $159,243 | $307,110 |
| 2024 | $7,395 | $464,752 | $0 | $0 |
| 2023 | $5,334 | $422,502 | $0 | $0 |
| 2022 | $6,584 | $384,093 | $0 | $0 |
| 2021 | $6,607 | $349,175 | $63,776 | $285,399 |
| 2020 | $4,092 | $242,388 | $46,820 | $195,568 |
| 2019 | $4,855 | $227,977 | $46,820 | $181,157 |
| 2018 | $3,638 | $171,027 | $40,924 | $130,103 |
| 2017 | $3,560 | $166,282 | $42,122 | $124,160 |
| 2016 | $3,264 | $152,458 | $39,577 | $112,881 |
Source: Public Records
Map
Nearby Homes
- 263 Esquire Dr
- 10 Ac Fm 1753 Hwy
- TBDT Dugan Chapel Rd
- 131 Dugan Chapel Rd
- TBD Dugan Chapel Rd
- TBD Lil Arkansas Rd
- 0 Tbd2 Fleming Rd
- 0 Fleming Rd
- 5994 Fm 1753
- 6294 Dugan Chapel Rd
- 469 Dugan Chapel Rd
- 2760 Fm 1897
- 598 Stagecoach Trail
- 40 acres Neq of Hwy 69 and Hwy 82 Hwy
- 248 Shaffer Rd
- 4822 Fm 1753
- TBD Neq of Hwy 69 and Hwy 82 H Hwy Unit Lot 9
- TBD Neq of Hwy 69 and Hwy 82 Hwy Unit Lot 13
- TBD Neq of Hwy 69 and Hwy 82 Hwy Unit Lot 7
- TBD Neq of Hwy 69 and Hwy 82 Hwy Unit Lot 5
Your Personal Tour Guide
Ask me questions while you tour the home.