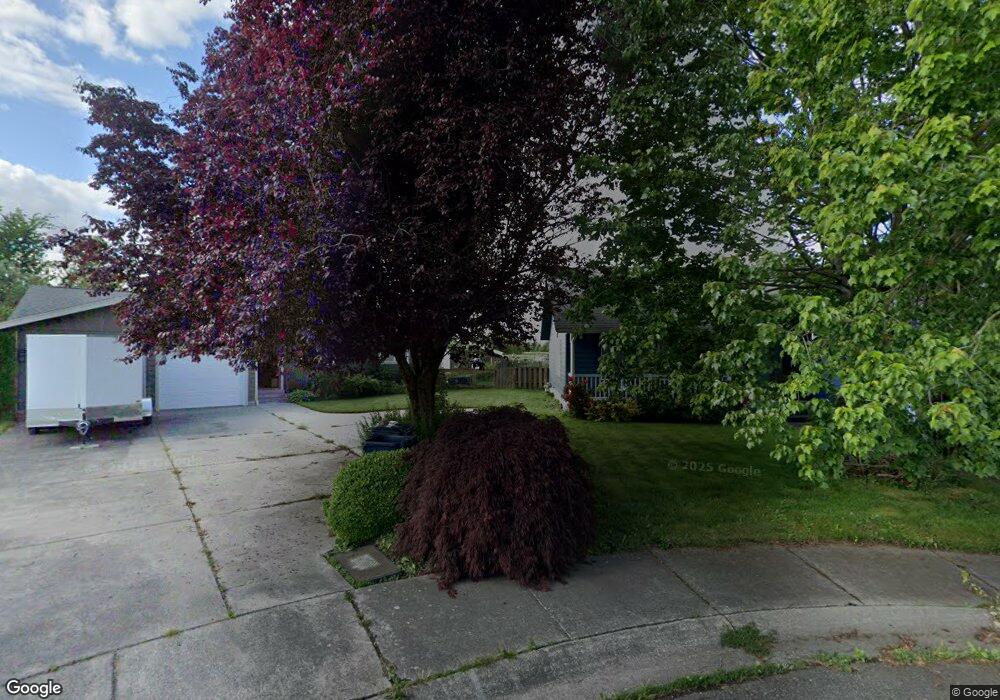
412 Dennison Ln Nooksack, WA 98247
Estimated Value: $474,000 - $658,000
3
Beds
3
Baths
2,396
Sq Ft
$234/Sq Ft
Est. Value
About This Home
This home is located at 412 Dennison Ln, Nooksack, WA 98247 and is currently estimated at $561,244, approximately $234 per square foot. 412 Dennison Ln is a home located in Whatcom County with nearby schools including Nooksack Elementary School, Everson Elementary School, and Sumas Elementary School.
Ownership History
Date
Name
Owned For
Owner Type
Purchase Details
Closed on
Apr 13, 2009
Sold by
Linville Michael P and Linville Larinda
Bought by
Thayer Evan C and Thayer Terri L
Current Estimated Value
Home Financials for this Owner
Home Financials are based on the most recent Mortgage that was taken out on this home.
Original Mortgage
$281,801
Outstanding Balance
$178,026
Interest Rate
5.17%
Mortgage Type
FHA
Estimated Equity
$383,218
Create a Home Valuation Report for This Property
The Home Valuation Report is an in-depth analysis detailing your home's value as well as a comparison with similar homes in the area
Purchase History
| Date | Buyer | Sale Price | Title Company |
|---|---|---|---|
| Thayer Evan C | $287,280 | Whatcom Land Title Company I |
Source: Public Records
Mortgage History
| Date | Status | Borrower | Loan Amount |
|---|---|---|---|
| Open | Thayer Evan C | $281,801 |
Source: Public Records
Tax History
| Year | Tax Paid | Tax Assessment Tax Assessment Total Assessment is a certain percentage of the fair market value that is determined by local assessors to be the total taxable value of land and additions on the property. | Land | Improvement |
|---|---|---|---|---|
| 2025 | $4,376 | $493,868 | $188,100 | $305,768 |
| 2024 | $4,331 | $478,310 | $180,000 | $298,310 |
| 2023 | $4,331 | $491,235 | $137,744 | $353,491 |
| 2022 | $3,965 | $442,562 | $124,096 | $318,466 |
| 2021 | $3,677 | $365,758 | $102,560 | $263,198 |
| 2020 | $3,526 | $297,371 | $83,384 | $213,987 |
| 2019 | $2,971 | $297,371 | $83,384 | $213,987 |
| 2018 | $3,508 | $285,303 | $80,000 | $205,303 |
| 2017 | $3,134 | $250,646 | $63,800 | $186,846 |
| 2016 | $2,993 | $231,299 | $58,850 | $172,449 |
| 2015 | $2,539 | $221,850 | $56,760 | $165,090 |
| 2014 | -- | $214,971 | $55,000 | $159,971 |
| 2013 | -- | $214,971 | $55,000 | $159,971 |
Source: Public Records
Map
Nearby Homes
- 412 W 3rd St
- 404 W 3rd St
- 308 W 3rd St
- 304 W 3rd St
- 303 Hayes St
- 109 W 2nd St
- 107 Thendara Park Dr Unit C
- 512 Allison Way
- 107 S Pass Rd Unit 23
- 702 N Washington St
- 705 E 6th St
- 207 E Main St
- 108 Baker St Unit 1-4
- 409 W 4th St
- 3292 S Pass Rd
- 7554 Nooksack Rd
- 303 Lincoln St
- 0 Walnut Grove Ct
- 408 W 3rd St
- 416 W 3rd St
- 410 Dennison Ln
- 414 Dennison Ln
- 408 Dennison Ln
- 601 W 3rd St
- 416 Dennison Ln
- 411 Dennison Ln
- 409 Dennison Ln
- 406 Dennison Ln
- 415 Dennison Ln
- 413 Dennison Ln
- 404 Dennison Ln
- 405 Dennison Ln
- 407 Dennison Ln
- 412 Jackson Ct
- 403 Dennison Ln
- 410 Jackson Ct
- 408 Jackson Ct Unit Lot 5
- 408 Jackson Ct
- 511 W 3rd St
- 402 Dennison Ln
Your Personal Tour Guide
Ask me questions while you tour the home.