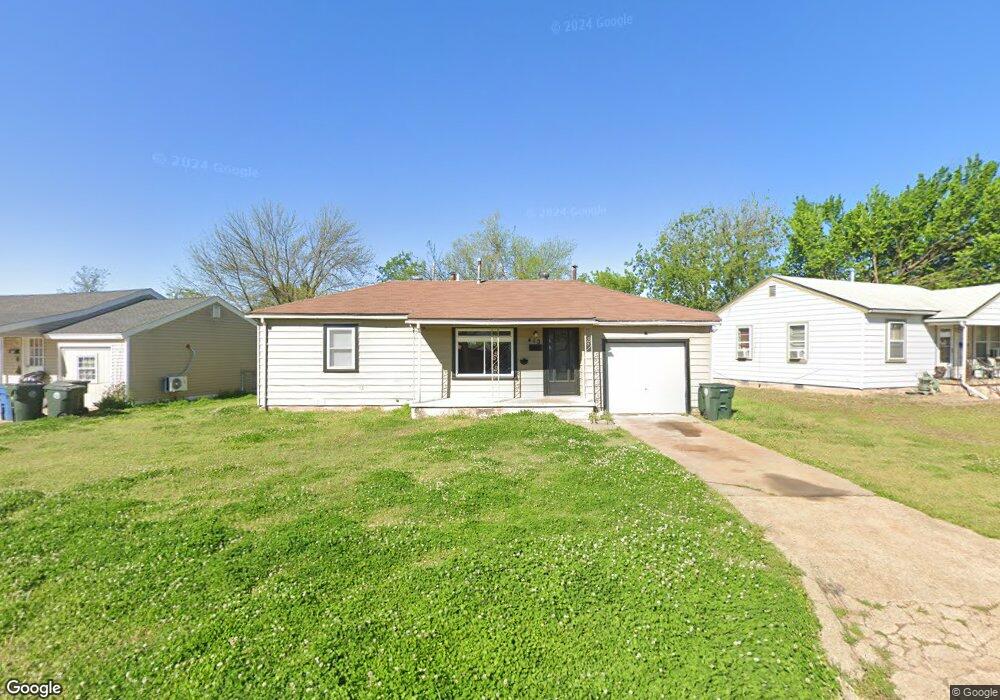
412 E Jarman Dr Oklahoma City, OK 73110
Estimated Value: $87,000 - $104,000
2
Beds
1
Bath
704
Sq Ft
$136/Sq Ft
Est. Value
About This Home
This home is located at 412 E Jarman Dr, Oklahoma City, OK 73110 and is currently estimated at $95,534, approximately $135 per square foot. 412 E Jarman Dr is a home located in Oklahoma County with nearby schools including Country Estates Elementary School, Midwest City Middle School, and Midwest City High School.
Ownership History
Date
Name
Owned For
Owner Type
Purchase Details
Closed on
Oct 26, 2011
Sold by
Secretary Of Housing & Urban Development
Bought by
Jackson Kyle H and Jackson Candice E
Current Estimated Value
Purchase Details
Closed on
Jul 11, 2011
Sold by
Smalling John and Case #Cj-2010-8925
Bought by
Wells Fargo Bank N A
Purchase Details
Closed on
May 2, 2008
Sold by
Wooten Sara M and Hawkins William
Bought by
Smalling John
Home Financials for this Owner
Home Financials are based on the most recent Mortgage that was taken out on this home.
Original Mortgage
$51,592
Interest Rate
5.89%
Mortgage Type
FHA
Purchase Details
Closed on
Nov 15, 2002
Sold by
Reece Harold D and Reece Janet K
Bought by
Wooten Sara M
Purchase Details
Closed on
Aug 22, 2002
Sold by
Reece Deana Rochelle and Reece Harold D
Bought by
Reece Harold D and Reece Janet K
Create a Home Valuation Report for This Property
The Home Valuation Report is an in-depth analysis detailing your home's value as well as a comparison with similar homes in the area
Home Values in the Area
Average Home Value in this Area
Purchase History
| Date | Buyer | Sale Price | Title Company |
|---|---|---|---|
| Jackson Kyle H | -- | Heartland Title & Closing Ll | |
| Wells Fargo Bank N A | -- | None Available | |
| Smalling John | $52,000 | Lawyers Title Of Ok City Inc | |
| Wooten Sara M | $42,000 | First Amer Title & Trust Co | |
| Reece Harold D | -- | Capitol Abstract & Title Co |
Source: Public Records
Mortgage History
| Date | Status | Borrower | Loan Amount |
|---|---|---|---|
| Previous Owner | Smalling John | $51,592 |
Source: Public Records
Tax History
| Year | Tax Paid | Tax Assessment Tax Assessment Total Assessment is a certain percentage of the fair market value that is determined by local assessors to be the total taxable value of land and additions on the property. | Land | Improvement |
|---|---|---|---|---|
| 2025 | $819 | $7,019 | $1,272 | $5,747 |
| 2024 | $749 | $6,684 | $1,328 | $5,356 |
| 2023 | $749 | $6,366 | $979 | $5,387 |
| 2022 | $707 | $6,063 | $1,079 | $4,984 |
| 2021 | $690 | $5,775 | $1,232 | $4,543 |
| 2020 | $675 | $5,500 | $1,302 | $4,198 |
| 2019 | $685 | $5,832 | $1,111 | $4,721 |
| 2018 | $612 | $5,555 | $0 | $0 |
| 2017 | $622 | $5,554 | $1,120 | $4,434 |
| 2016 | $639 | $5,554 | $1,120 | $4,434 |
| 2015 | $678 | $5,655 | $1,508 | $4,147 |
| 2014 | $661 | $5,526 | $1,508 | $4,018 |
Source: Public Records
Map
Nearby Homes
Your Personal Tour Guide
Ask me questions while you tour the home.