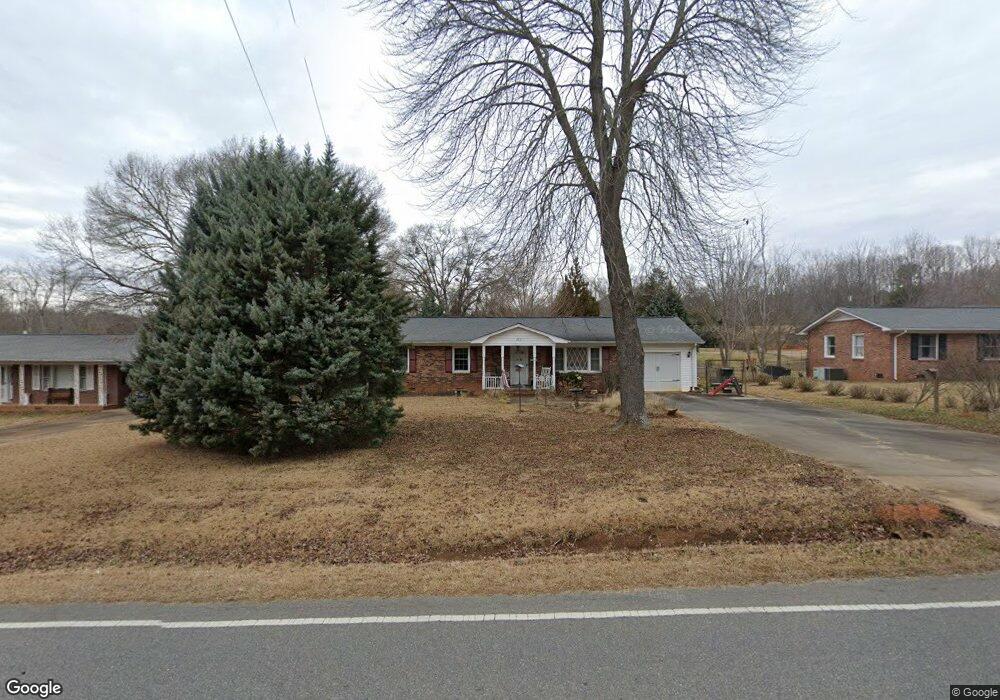
412 Faulkner St Clover, SC 29710
Estimated Value: $239,669 - $308,000
--
Bed
--
Bath
1,253
Sq Ft
$218/Sq Ft
Est. Value
About This Home
This home is located at 412 Faulkner St, Clover, SC 29710 and is currently estimated at $272,667, approximately $217 per square foot. 412 Faulkner St is a home located in York County with nearby schools including Kinard Elementary School, Clover Middle School, and Clover High School.
Ownership History
Date
Name
Owned For
Owner Type
Purchase Details
Closed on
Aug 23, 2006
Sold by
Weinkauf Josef E and Weinkauf Donna E
Bought by
Trolley Diana J
Current Estimated Value
Home Financials for this Owner
Home Financials are based on the most recent Mortgage that was taken out on this home.
Original Mortgage
$93,600
Outstanding Balance
$55,353
Interest Rate
6.58%
Mortgage Type
New Conventional
Estimated Equity
$217,314
Purchase Details
Closed on
Mar 31, 2005
Sold by
Abernathy Bobby Alan
Bought by
Weinkauf Josef E and Weinkauf Donna E
Home Financials for this Owner
Home Financials are based on the most recent Mortgage that was taken out on this home.
Original Mortgage
$114,900
Interest Rate
5.74%
Mortgage Type
New Conventional
Purchase Details
Closed on
Dec 6, 2004
Sold by
Citifinancial Mortgage Co Inc
Bought by
Abernathy Bobby Alan
Purchase Details
Closed on
Oct 12, 2004
Sold by
Goforth Robert L and Goforth Carol Ann
Bought by
Citifinancial Mortgage Co Inc
Create a Home Valuation Report for This Property
The Home Valuation Report is an in-depth analysis detailing your home's value as well as a comparison with similar homes in the area
Home Values in the Area
Average Home Value in this Area
Purchase History
| Date | Buyer | Sale Price | Title Company |
|---|---|---|---|
| Trolley Diana J | $117,000 | None Available | |
| Weinkauf Josef E | $114,900 | -- | |
| Abernathy Bobby Alan | $60,000 | -- | |
| Citifinancial Mortgage Co Inc | $500 | -- |
Source: Public Records
Mortgage History
| Date | Status | Borrower | Loan Amount |
|---|---|---|---|
| Open | Trolley Diana J | $93,600 | |
| Previous Owner | Weinkauf Josef E | $114,900 |
Source: Public Records
Tax History Compared to Growth
Tax History
| Year | Tax Paid | Tax Assessment Tax Assessment Total Assessment is a certain percentage of the fair market value that is determined by local assessors to be the total taxable value of land and additions on the property. | Land | Improvement |
|---|---|---|---|---|
| 2025 | $753 | $5,026 | $945 | $4,081 |
| 2024 | $604 | $4,370 | $774 | $3,596 |
| 2023 | $600 | $4,370 | $774 | $3,596 |
| 2022 | $542 | $4,370 | $774 | $3,596 |
| 2021 | -- | $4,370 | $774 | $3,596 |
| 2020 | $522 | $4,370 | $0 | $0 |
| 2019 | $424 | $3,800 | $0 | $0 |
| 2018 | $420 | $3,800 | $0 | $0 |
| 2017 | $398 | $3,800 | $0 | $0 |
| 2016 | $394 | $3,800 | $0 | $0 |
| 2014 | $876 | $3,800 | $880 | $2,920 |
| 2013 | $876 | $4,120 | $880 | $3,240 |
Source: Public Records
Map
Nearby Homes
- 202 Alexander St
- 534 Pennyfields Ln
- 132 Oak St
- 229 Price St
- 208 Forest St
- 7+/- Acres Forest St
- 206 Frances St
- 210 Smith St
- 111 Sunset Dr
- 395 Lone Tree Ln
- 101 Ridge Ave
- 2001 Roscommon Dr
- 1526 Glenbar Ct
- 107 Pressley St
- 909 S Main St
- 743 Victory Gallop Ave
- 307 Kings Mountain St
- 221 Kings Mountain St
- 303 Kings Mountain St
- 206 Mcconnell St
- 410 Faulkner St
- 410 Faulkner St Unit 5
- 414 Faulkner St
- 408 Faulkner St
- 408 Faulkner St
- 411 Stokes Ave
- 416 Faulkner St
- 413 Stokes Ave
- 413 Faulkner St
- 411 Faulkner St
- 406 Faulkner St
- 407 Stokes Ave
- 407 Stokes Ave
- 0 Faulkner Rd
- 415 Faulkner St
- 415 Stokes Ave
- 405 Faulkner St
- 404 Faulkner St
- 417 Faulkner St
- 420 Faulkner St