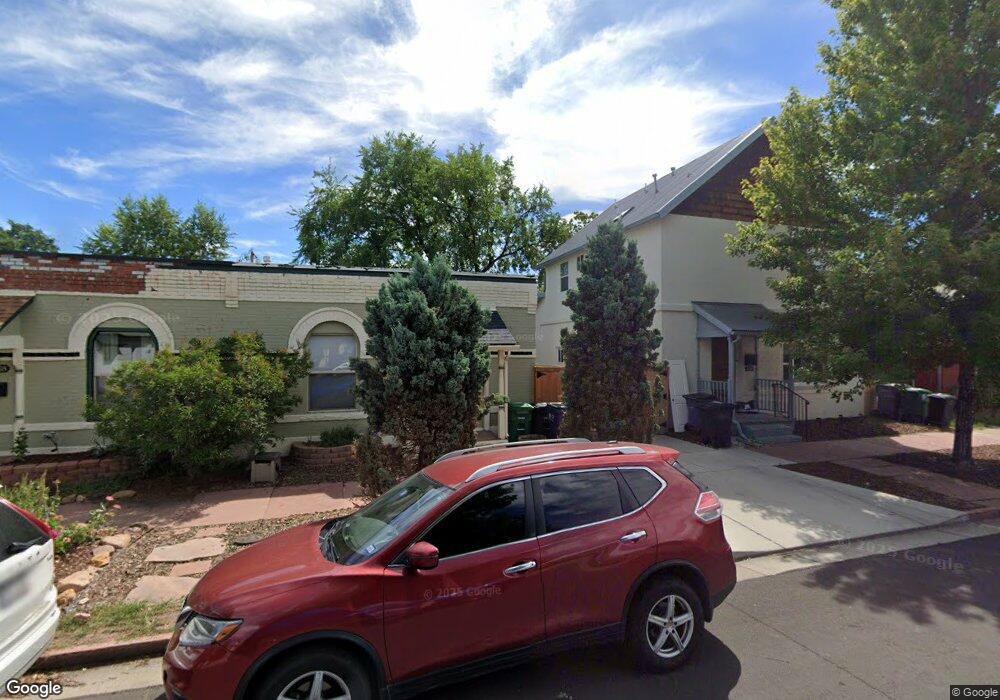
412 Fox St Denver, CO 80204
Baker NeighborhoodEstimated Value: $359,757 - $415,000
2
Beds
1
Bath
775
Sq Ft
$511/Sq Ft
Est. Value
About This Home
This home is located at 412 Fox St, Denver, CO 80204 and is currently estimated at $395,689, approximately $510 per square foot. 412 Fox St is a home located in Denver County with nearby schools including Kepner Beacon Middle School, West High School, and Girls Athletic Leadership School.
Ownership History
Date
Name
Owned For
Owner Type
Purchase Details
Closed on
Jul 31, 2013
Sold by
Tarkanian Eric
Bought by
Rivas Gustavo
Current Estimated Value
Home Financials for this Owner
Home Financials are based on the most recent Mortgage that was taken out on this home.
Original Mortgage
$192,308
Outstanding Balance
$138,534
Interest Rate
3.93%
Mortgage Type
New Conventional
Estimated Equity
$257,155
Purchase Details
Closed on
Oct 31, 2002
Sold by
Ackerman Jeffrey D
Bought by
Tarkanian Eric
Home Financials for this Owner
Home Financials are based on the most recent Mortgage that was taken out on this home.
Original Mortgage
$144,400
Interest Rate
7.72%
Purchase Details
Closed on
Oct 17, 1996
Sold by
Anthony Bernard
Bought by
Martinez Gino
Home Financials for this Owner
Home Financials are based on the most recent Mortgage that was taken out on this home.
Original Mortgage
$31,350
Interest Rate
8.31%
Create a Home Valuation Report for This Property
The Home Valuation Report is an in-depth analysis detailing your home's value as well as a comparison with similar homes in the area
Home Values in the Area
Average Home Value in this Area
Purchase History
| Date | Buyer | Sale Price | Title Company |
|---|---|---|---|
| Rivas Gustavo | $198,500 | Land Title Guarantee Company | |
| Tarkanian Eric | $152,000 | North American Title Co | |
| Martinez Gino | $33,000 | Stewart Title |
Source: Public Records
Mortgage History
| Date | Status | Borrower | Loan Amount |
|---|---|---|---|
| Open | Rivas Gustavo | $192,308 | |
| Previous Owner | Tarkanian Eric | $144,400 | |
| Previous Owner | Martinez Gino | $31,350 |
Source: Public Records
Tax History
| Year | Tax Paid | Tax Assessment Tax Assessment Total Assessment is a certain percentage of the fair market value that is determined by local assessors to be the total taxable value of land and additions on the property. | Land | Improvement |
|---|---|---|---|---|
| 2025 | $1,912 | $27,730 | $7,000 | $7,000 |
| 2024 | $1,912 | $24,140 | $2,970 | $21,170 |
| 2023 | $1,871 | $24,140 | $2,970 | $21,170 |
| 2022 | $1,812 | $22,790 | $5,870 | $16,920 |
| 2021 | $1,749 | $23,440 | $6,030 | $17,410 |
| 2020 | $1,599 | $21,550 | $4,080 | $17,470 |
| 2019 | $1,554 | $21,550 | $4,080 | $17,470 |
| 2018 | $1,282 | $16,570 | $3,040 | $13,530 |
| 2017 | $1,278 | $16,570 | $3,040 | $13,530 |
| 2016 | $1,275 | $15,630 | $2,571 | $13,059 |
| 2015 | $1,221 | $15,630 | $2,571 | $13,059 |
| 2014 | $945 | $11,380 | $661 | $10,719 |
Source: Public Records
Map
Nearby Homes
- 431 Fox St
- 521 Fox St
- 475 Galapago St Unit 3
- 447 Galapago St
- 345 Delaware St Unit 347
- 321 Fox St
- 314 Galapago St
- 603 Elati St
- 551 Cherokee St
- 804 W 4th Ave
- 315 Galapago St
- 701 W 6th Ave
- 722 W 6th Ave
- 630 Elati St
- 323 Inca St
- 639 Galapago St
- 326 Santa fe Dr
- 274 Delaware St
- 444 Bannock St
- 257 Cherokee St
Your Personal Tour Guide
Ask me questions while you tour the home.