Estimated Value: $179,000 - $189,000
4
Beds
3
Baths
1,984
Sq Ft
$93/Sq Ft
Est. Value
About This Home
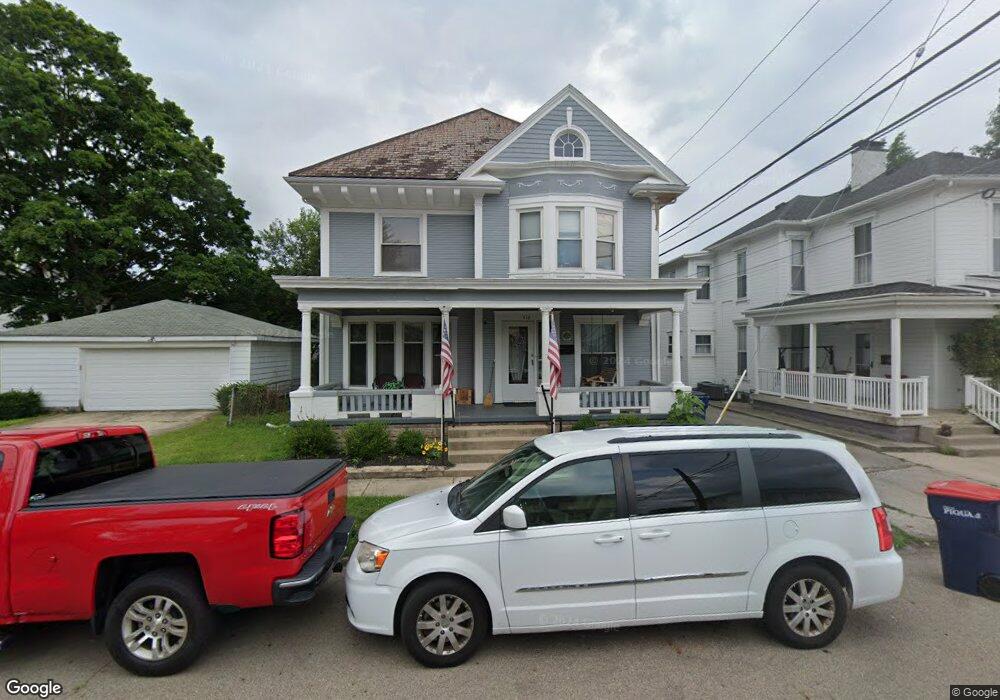
This home is located at 412 Franklin St, Piqua, OH 45356 and is currently estimated at $184,009, approximately $92 per square foot. 412 Franklin St is a home located in Miami County with nearby schools including Washington Primary School, Piqua Junior High School, and Piqua High School.
Ownership History
Date
Name
Owned For
Owner Type
Purchase Details
Closed on
May 21, 2025
Sold by
Malone Jody M and Malone Elizabeth E
Bought by
Malone Quinton A and Malone Clayton M
Current Estimated Value
Purchase Details
Closed on
Apr 2, 1996
Sold by
Ford John C Honing
Bought by
Gearheardt Corey L and Gearheardt Brenda S
Home Financials for this Owner
Home Financials are based on the most recent Mortgage that was taken out on this home.
Original Mortgage
$95,000
Interest Rate
6.98%
Mortgage Type
New Conventional
Purchase Details
Closed on
Nov 7, 1994
Sold by
Grace United Methodist C
Bought by
Honingford John C and Honingford Carol F
Home Financials for this Owner
Home Financials are based on the most recent Mortgage that was taken out on this home.
Original Mortgage
$88,300
Interest Rate
8%
Mortgage Type
New Conventional
Create a Home Valuation Report for This Property
The Home Valuation Report is an in-depth analysis detailing your home's value as well as a comparison with similar homes in the area
Home Values in the Area
Average Home Value in this Area
Purchase History
| Date | Buyer | Sale Price | Title Company |
|---|---|---|---|
| Malone Quinton A | -- | None Listed On Document | |
| Gearheardt Corey L | $100,000 | -- | |
| Honingford John C | $93,000 | -- |
Source: Public Records
Mortgage History
| Date | Status | Borrower | Loan Amount |
|---|---|---|---|
| Previous Owner | Gearheardt Corey L | $95,000 | |
| Previous Owner | Honingford John C | $88,300 |
Source: Public Records
Tax History Compared to Growth
Tax History
| Year | Tax Paid | Tax Assessment Tax Assessment Total Assessment is a certain percentage of the fair market value that is determined by local assessors to be the total taxable value of land and additions on the property. | Land | Improvement |
|---|---|---|---|---|
| 2024 | $1,556 | $36,890 | $5,810 | $31,080 |
| 2023 | $1,556 | $36,890 | $5,810 | $31,080 |
| 2022 | $1,582 | $36,890 | $5,810 | $31,080 |
| 2021 | $1,327 | $28,390 | $4,480 | $23,910 |
| 2020 | $1,305 | $28,390 | $4,480 | $23,910 |
| 2019 | $1,312 | $28,390 | $4,480 | $23,910 |
| 2018 | $1,390 | $28,670 | $4,480 | $24,190 |
| 2017 | $1,407 | $28,670 | $4,480 | $24,190 |
| 2016 | $1,393 | $28,670 | $4,480 | $24,190 |
| 2015 | $1,369 | $27,550 | $4,310 | $23,240 |
| 2014 | $1,369 | $27,550 | $4,310 | $23,240 |
| 2013 | $1,374 | $27,550 | $4,310 | $23,240 |
Source: Public Records
Map
Nearby Homes