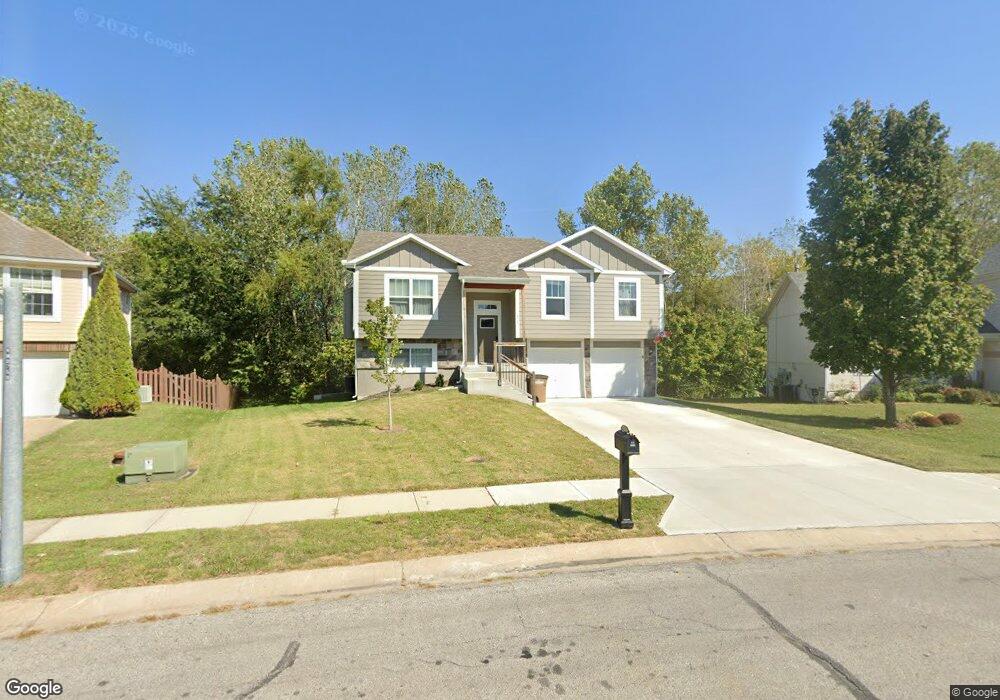
412 Granite Ct Raymore, MO 64083
Estimated Value: $339,939 - $358,000
4
Beds
3
Baths
2,150
Sq Ft
$163/Sq Ft
Est. Value
About This Home
This home is located at 412 Granite Ct, Raymore, MO 64083 and is currently estimated at $351,235, approximately $163 per square foot. 412 Granite Ct is a home located in Cass County with nearby schools including Creekmoor Elementary School, Raymore-Peculiar East Middle School, and Raymore-Peculiar Senior High School.
Ownership History
Date
Name
Owned For
Owner Type
Purchase Details
Closed on
Jun 13, 2023
Sold by
Fkh Sfr L Lp
Bought by
Fkh Sfr N Lp
Current Estimated Value
Purchase Details
Closed on
Jul 14, 2022
Sold by
Higgins Building Company Inc
Bought by
Fkh Sfr L Lp
Purchase Details
Closed on
Aug 29, 2018
Sold by
Kevin Hardee Homes Llc
Bought by
Higgins Building Company Inc
Purchase Details
Closed on
Dec 28, 2016
Sold by
Rff Development Llc
Bought by
Rymeg Inc
Purchase Details
Closed on
Sep 1, 2005
Sold by
Higgins Building Co Inc
Bought by
Rff Development Co Llc
Purchase Details
Closed on
May 25, 2005
Sold by
Rff Development Co Llc
Bought by
Higgins Building Co Inc
Home Financials for this Owner
Home Financials are based on the most recent Mortgage that was taken out on this home.
Original Mortgage
$110,000
Interest Rate
5.79%
Mortgage Type
Future Advance Clause Open End Mortgage
Create a Home Valuation Report for This Property
The Home Valuation Report is an in-depth analysis detailing your home's value as well as a comparison with similar homes in the area
Home Values in the Area
Average Home Value in this Area
Purchase History
| Date | Buyer | Sale Price | Title Company |
|---|---|---|---|
| Fkh Sfr N Lp | -- | None Listed On Document | |
| Fkh Sfr L Lp | -- | Stewart Title | |
| Higgins Building Company Inc | -- | Crescent Land Title | |
| Rymeg Inc | -- | None Available | |
| Rff Development Co Llc | -- | -- | |
| Higgins Building Co Inc | -- | -- |
Source: Public Records
Mortgage History
| Date | Status | Borrower | Loan Amount |
|---|---|---|---|
| Previous Owner | Higgins Building Co Inc | $110,000 |
Source: Public Records
Tax History
| Year | Tax Paid | Tax Assessment Tax Assessment Total Assessment is a certain percentage of the fair market value that is determined by local assessors to be the total taxable value of land and additions on the property. | Land | Improvement |
|---|---|---|---|---|
| 2025 | $3,573 | $49,850 | $5,770 | $44,080 |
| 2024 | $3,573 | $43,910 | $5,240 | $38,670 |
| 2023 | $3,569 | $43,910 | $5,240 | $38,670 |
| 2022 | $1,483 | $18,130 | $5,240 | $12,890 |
| 2021 | $214 | $2,620 | $2,620 | $0 |
| 2020 | $218 | $2,620 | $2,620 | $0 |
| 2019 | $211 | $2,620 | $2,620 | $0 |
| 2018 | $181 | $2,170 | $2,170 | $0 |
| 2017 | $174 | $2,170 | $2,170 | $0 |
| 2016 | $174 | $2,170 | $2,170 | $0 |
| 2015 | $174 | $2,170 | $2,170 | $0 |
| 2014 | $174 | $2,170 | $2,170 | $0 |
| 2013 | -- | $2,170 | $2,170 | $0 |
Source: Public Records
Map
Nearby Homes
- 721 Saddle Peak Dr
- 0 Madison Creek Dr
- 205 W Laredo Trail
- 706 Blazing Star Dr
- 612 Wild Lupine Ln
- 611 Wild Lupine Ln
- 708 Blazing Star Dr
- 710 Blazing Star Dr
- 603 Mayfair Ct
- 608 Wild Lupine Ln
- 609 Foxglove Ln
- 614 Foxglove Ln
- 600 Mayfair Ct
- 602 Mayfair Ct
- 1014 Branchwood Ln
- 700 Red Clover Ct
- 702 Red Clover Ct
- 704 Red Clover Ct
- 701 Glenn Cir
- 602 Foxglove Ln
- 410 Granite Ct
- 414 Granite Ct
- 408 Granite Ct
- 416 Granite Ct
- 411 Granite Ct
- 806 N Madison St
- 807 Saddle Peak Dr
- 418 Granite Dr
- 406 Granite Ct
- 805 Saddle Peak Dr
- 403 Granite Ct
- 420 Granite Dr
- 230 N Madison St
- 0 N Madison St
- 404 Granite Ct
- 803 Saddle Peak Dr
- 402 Granite Ct
- 422 Granite Dr
- 420 Pinnacle Dr
- 801 Saddle Peak Dr
Your Personal Tour Guide
Ask me questions while you tour the home.