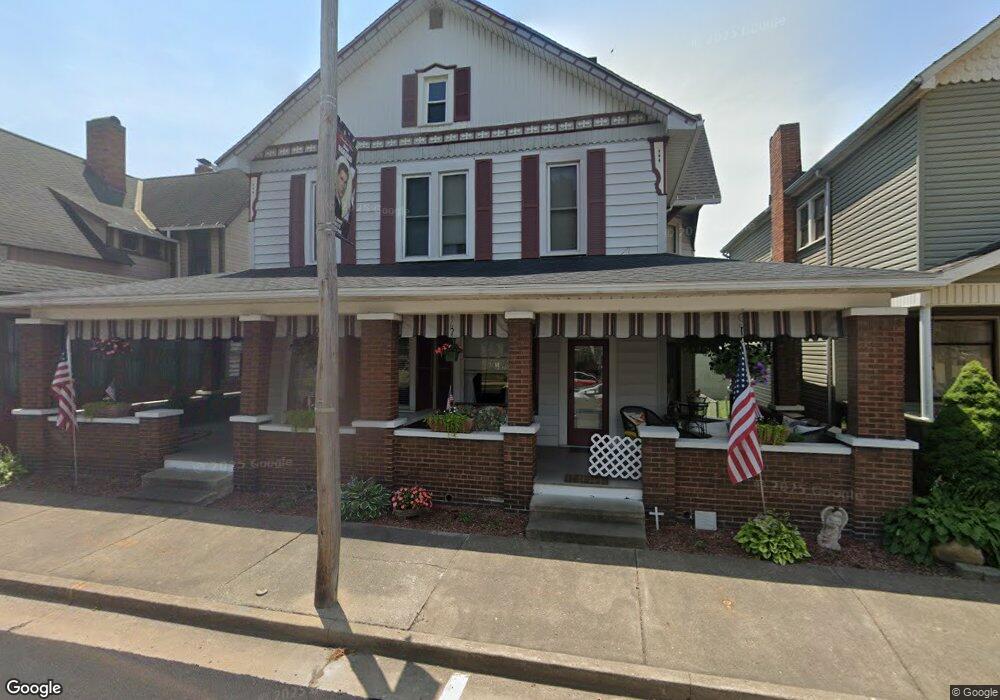
412 Grant St Dennison, OH 44621
Estimated Value: $119,000 - $1,118,000
7
Beds
2
Baths
3,366
Sq Ft
$136/Sq Ft
Est. Value
About This Home
This home is located at 412 Grant St, Dennison, OH 44621 and is currently estimated at $458,138, approximately $136 per square foot. 412 Grant St is a home located in Tuscarawas County with nearby schools including Claymont High School and Immaculate Conception School.
Ownership History
Date
Name
Owned For
Owner Type
Purchase Details
Closed on
Jul 11, 2007
Sold by
Spencer Dawn
Bought by
Didonato Gregory L
Current Estimated Value
Purchase Details
Closed on
Aug 7, 2006
Sold by
Burdick Michael and Burdick Elizabeth
Bought by
Spencer Dawn
Purchase Details
Closed on
Aug 30, 1996
Sold by
Smith Eunice E
Bought by
Spencer Dawn J
Home Financials for this Owner
Home Financials are based on the most recent Mortgage that was taken out on this home.
Original Mortgage
$50,000
Interest Rate
8.3%
Mortgage Type
New Conventional
Create a Home Valuation Report for This Property
The Home Valuation Report is an in-depth analysis detailing your home's value as well as a comparison with similar homes in the area
Home Values in the Area
Average Home Value in this Area
Purchase History
| Date | Buyer | Sale Price | Title Company |
|---|---|---|---|
| Didonato Gregory L | $45,000 | Attorney | |
| Spencer Dawn | -- | Tusc Title | |
| Spencer Dawn J | $64,000 | -- |
Source: Public Records
Mortgage History
| Date | Status | Borrower | Loan Amount |
|---|---|---|---|
| Previous Owner | Spencer Dawn J | $50,000 |
Source: Public Records
Tax History
| Year | Tax Paid | Tax Assessment Tax Assessment Total Assessment is a certain percentage of the fair market value that is determined by local assessors to be the total taxable value of land and additions on the property. | Land | Improvement |
|---|---|---|---|---|
| 2024 | $1,352 | $103,830 | $11,500 | $92,330 |
| 2023 | $1,352 | $103,830 | $11,500 | $92,330 |
| 2022 | $1,359 | $36,341 | $4,025 | $32,316 |
| 2021 | $1,248 | $31,112 | $3,052 | $28,060 |
| 2020 | $1,273 | $31,112 | $3,052 | $28,060 |
| 2019 | $1,221 | $31,112 | $3,052 | $28,060 |
| 2018 | $1,081 | $26,260 | $2,580 | $23,680 |
| 2017 | $1,136 | $26,260 | $2,580 | $23,680 |
| 2016 | $1,129 | $26,260 | $2,580 | $23,680 |
| 2014 | $1,109 | $25,410 | $2,450 | $22,960 |
| 2013 | $1,114 | $25,410 | $2,450 | $22,960 |
Source: Public Records
Map
Nearby Homes
Your Personal Tour Guide
Ask me questions while you tour the home.