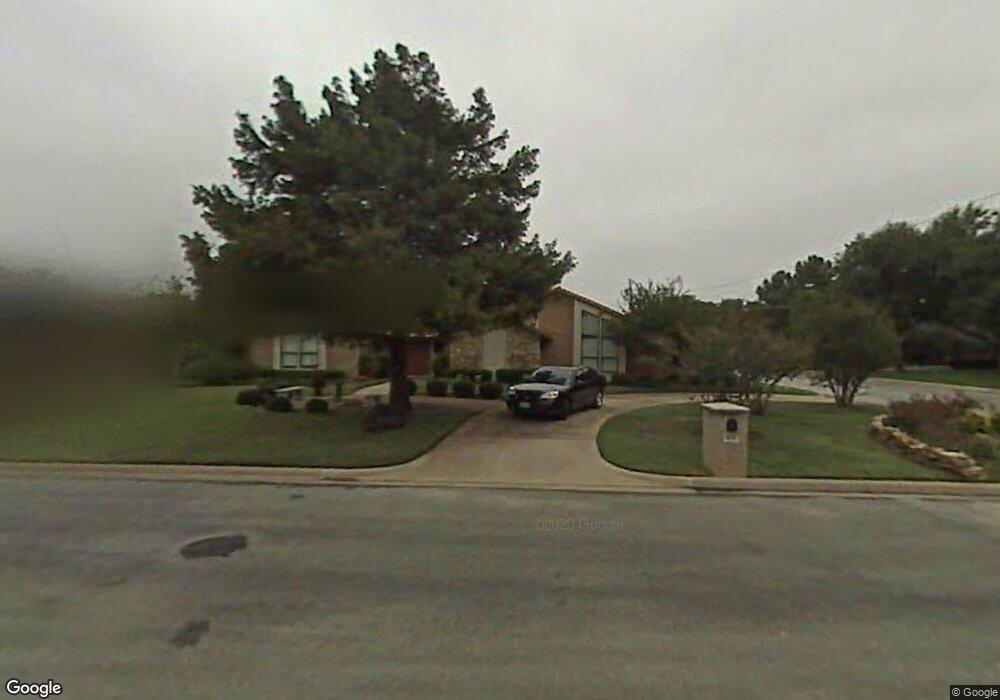
412 Greenbriar Ln Colleyville, TX 76034
Estimated Value: $599,000 - $664,000
3
Beds
3
Baths
2,703
Sq Ft
$233/Sq Ft
Est. Value
About This Home
This home is located at 412 Greenbriar Ln, Colleyville, TX 76034 and is currently estimated at $630,469, approximately $233 per square foot. 412 Greenbriar Ln is a home located in Tarrant County with nearby schools including Bedford Heights Elementary School, Bedford Junior High School, and L.D. Bell High School.
Ownership History
Date
Name
Owned For
Owner Type
Purchase Details
Closed on
May 5, 2020
Sold by
Hinson Dana Y
Bought by
Chandler Deanne D
Current Estimated Value
Purchase Details
Closed on
Dec 9, 2009
Sold by
Schmulen Matthew A and Schmulen Matthew Aaron
Bought by
Hinson Dana Y
Home Financials for this Owner
Home Financials are based on the most recent Mortgage that was taken out on this home.
Original Mortgage
$224,000
Interest Rate
5.06%
Mortgage Type
New Conventional
Purchase Details
Closed on
Oct 14, 2008
Sold by
Schmulen Tejal Vyas
Bought by
Schmulen Matthew Aaron
Purchase Details
Closed on
Sep 7, 2005
Sold by
Sills James A and Sills Lorna E
Bought by
Schmulen Matthew A and Schmulen Tejal
Home Financials for this Owner
Home Financials are based on the most recent Mortgage that was taken out on this home.
Original Mortgage
$216,800
Interest Rate
5.78%
Mortgage Type
Fannie Mae Freddie Mac
Create a Home Valuation Report for This Property
The Home Valuation Report is an in-depth analysis detailing your home's value as well as a comparison with similar homes in the area
Home Values in the Area
Average Home Value in this Area
Purchase History
| Date | Buyer | Sale Price | Title Company |
|---|---|---|---|
| Chandler Deanne D | -- | Itc | |
| Hinson Dana Y | -- | Fwt | |
| Schmulen Matthew Aaron | -- | None Available | |
| Schmulen Matthew A | -- | Alamo Title Company |
Source: Public Records
Mortgage History
| Date | Status | Borrower | Loan Amount |
|---|---|---|---|
| Previous Owner | Hinson Dana Y | $224,000 | |
| Previous Owner | Schmulen Matthew A | $216,800 | |
| Closed | Schmulen Matthew Aaron | $0 |
Source: Public Records
Tax History Compared to Growth
Tax History
| Year | Tax Paid | Tax Assessment Tax Assessment Total Assessment is a certain percentage of the fair market value that is determined by local assessors to be the total taxable value of land and additions on the property. | Land | Improvement |
|---|---|---|---|---|
| 2025 | $6,139 | $455,172 | $115,000 | $340,172 |
| 2024 | $6,139 | $508,000 | $115,000 | $393,000 |
| 2023 | $7,280 | $507,089 | $85,000 | $422,089 |
| 2022 | $7,683 | $460,413 | $85,000 | $375,413 |
| 2021 | $7,474 | $357,442 | $85,000 | $272,442 |
| 2020 | $7,561 | $357,442 | $85,000 | $272,442 |
| 2019 | $7,822 | $357,442 | $85,000 | $272,442 |
| 2018 | $6,178 | $351,242 | $85,000 | $266,242 |
| 2017 | $7,339 | $362,806 | $50,000 | $312,806 |
| 2016 | $6,671 | $320,326 | $50,000 | $270,326 |
| 2015 | $6,017 | $265,800 | $35,000 | $230,800 |
| 2014 | $6,017 | $300,300 | $35,000 | $265,300 |
Source: Public Records
Map
Nearby Homes
- 405 Woodbriar Ct
- 628 Huntwich Dr
- 305 Warbler Dr
- 909 Brestol Ct W
- 3605 Spring Valley Dr
- 3713 Brentwood Ct
- 3609 Wayne Ct
- 3624 Wayne Ct
- 320 Blue Quail Ct
- 2732 Woodbridge Dr
- 2620 Brookridge Dr
- 4105 Inwood Ln
- 3213 Spring Valley Dr
- 4600 Bransford Rd
- 1109 Simpson Terrace
- 913 Kensington Ct
- 312 Bremen Dr
- 4002 Copperwood Ct
- 405 Bremen Dr
- 3119 Spring Grove Dr
- 408 Greenbriar Ln
- 409 Briarcliff Ct
- 3801 Oakbriar Ln
- 405 Briarcliff Ct
- 404 Greenbriar Ln
- 3805 Oakbriar Ln
- 3720 Oakbriar Ln
- 401 Briarcliff Ct
- 3725 Oakbriar Ln
- 3809 Oakbriar Ln
- 400 Greenbriar Ln
- 313 Briarcliff Ct
- 3721 Briarhaven Ln
- 3716 Oakbriar Ln
- 412 Briarcliff Ct
- 408 Briarcliff Ct
- 3813 Oakbriar Ln
- 4017 Treemont Cir
- 4013 Treemont Cir
- 312 Greenbriar Ln