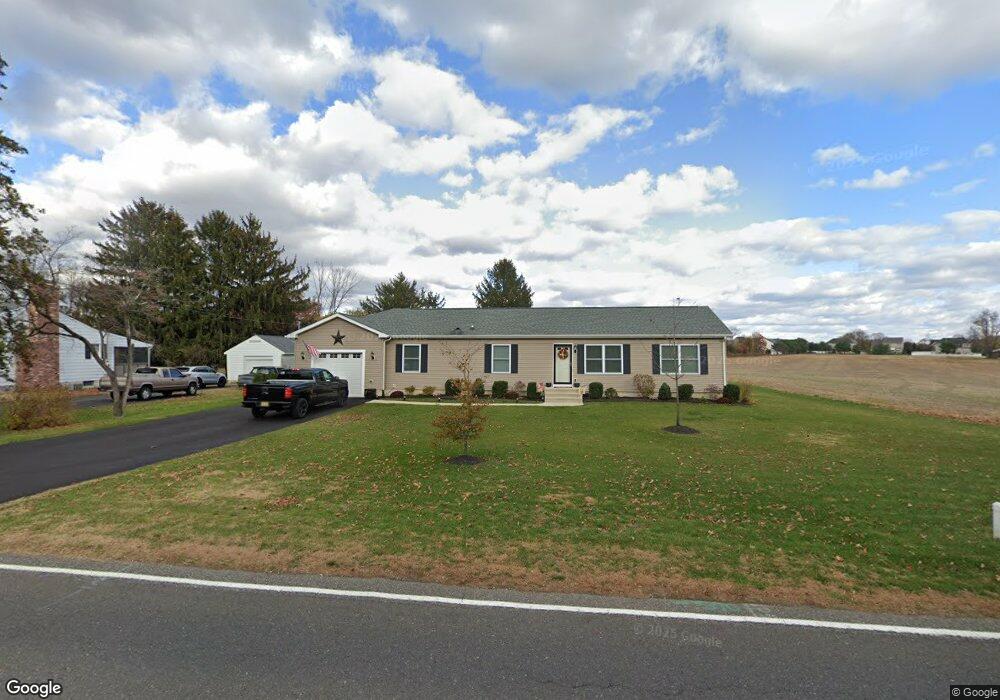
412 Landing St Lumberton, NJ 08048
Estimated Value: $420,968 - $589,000
--
Bed
--
Bath
1,508
Sq Ft
$322/Sq Ft
Est. Value
About This Home
This home is located at 412 Landing St, Lumberton, NJ 08048 and is currently estimated at $484,992, approximately $321 per square foot. 412 Landing St is a home located in Burlington County with nearby schools including Ashbrook Elementary School, Bobby’s Run School, and Lumberton Middle School.
Ownership History
Date
Name
Owned For
Owner Type
Purchase Details
Closed on
Sep 1, 2016
Sold by
Nioppins Frank Barry and Green Diana Nippins
Bought by
Nippins Laura
Current Estimated Value
Purchase Details
Closed on
Jul 5, 2016
Sold by
Nippins Frank Barry
Bought by
Nippins Frank Barry and Green Diana Nippins
Create a Home Valuation Report for This Property
The Home Valuation Report is an in-depth analysis detailing your home's value as well as a comparison with similar homes in the area
Home Values in the Area
Average Home Value in this Area
Purchase History
| Date | Buyer | Sale Price | Title Company |
|---|---|---|---|
| Nippins Laura | -- | None Available | |
| Nippins Frank Barry | -- | Attorney |
Source: Public Records
Tax History Compared to Growth
Tax History
| Year | Tax Paid | Tax Assessment Tax Assessment Total Assessment is a certain percentage of the fair market value that is determined by local assessors to be the total taxable value of land and additions on the property. | Land | Improvement |
|---|---|---|---|---|
| 2025 | $6,522 | $245,000 | $85,000 | $160,000 |
| 2024 | $6,132 | $245,000 | $85,000 | $160,000 |
| 2023 | $6,132 | $245,000 | $85,000 | $160,000 |
| 2022 | $5,990 | $245,000 | $85,000 | $160,000 |
| 2021 | $5,973 | $245,000 | $85,000 | $160,000 |
| 2020 | $5,864 | $242,600 | $85,000 | $157,600 |
| 2019 | $5,798 | $242,600 | $85,000 | $157,600 |
| 2018 | $2,177 | $92,500 | $85,000 | $7,500 |
| 2017 | $4,216 | $182,500 | $85,000 | $97,500 |
| 2016 | $4,125 | $182,500 | $85,000 | $97,500 |
| 2015 | $4,093 | $182,500 | $85,000 | $97,500 |
| 2014 | $3,938 | $182,500 | $85,000 | $97,500 |
Source: Public Records
Map
Nearby Homes
- 587 Main St
- 485 Main St
- 26 Chestnut St
- 15 Wellington Dr
- 5 Middleton Dr
- 10 Whitehaven Dr
- 71 Kingsbridge Dr
- 39 Bridge Rd
- 20 Jasmine Rd
- 18 Westminster Dr
- 23 Creek Rd
- 39 Tynemouth Dr
- 11 Abington Way
- 511 Hamilton Ave
- 18 Azalea Dr
- 44 Rockland Terrace
- 692 Eayrestown Rd
- 50 Blue Spruce Ct
- 225 Ashley Ln
- 25 Sunflower Cir