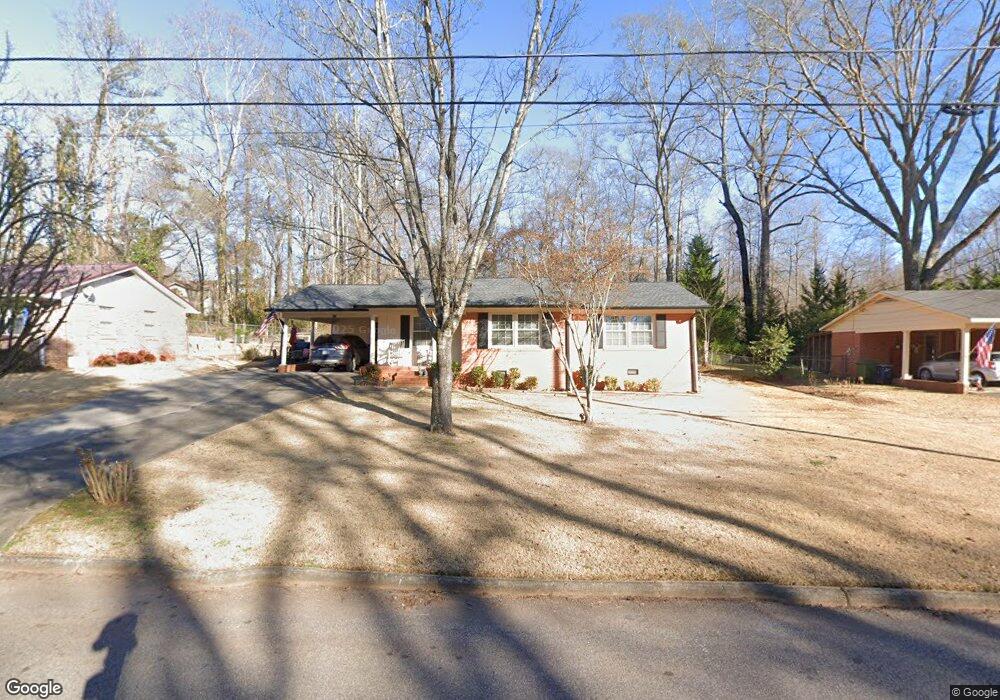
412 Leola Dr Griffin, GA 30224
Spalding County NeighborhoodEstimated Value: $183,347 - $217,000
3
Beds
2
Baths
1,360
Sq Ft
$149/Sq Ft
Est. Value
About This Home
This home is located at 412 Leola Dr, Griffin, GA 30224 and is currently estimated at $202,087, approximately $148 per square foot. 412 Leola Dr is a home located in Spalding County with nearby schools including Orrs Elementary School, Carver Road Middle School, and Griffin High School.
Ownership History
Date
Name
Owned For
Owner Type
Purchase Details
Closed on
Feb 5, 1992
Sold by
Johnson Jerry D and Johnson Dorothy K
Bought by
Johnson Alvin D
Current Estimated Value
Purchase Details
Closed on
Oct 31, 1978
Sold by
Admin Of Veterans Affairs
Bought by
Johnson Jerry D and Johnson Dorothy K
Purchase Details
Closed on
Jan 4, 1978
Sold by
Keen Jack A and Keen Linda R
Bought by
Admin Of Veterans Affairs
Purchase Details
Closed on
Nov 30, 1976
Sold by
Gibson Allen J and Gibson Deborah F
Bought by
Keen Jack A and Keen Linda R
Purchase Details
Closed on
Mar 28, 1974
Sold by
Imes Ann B
Bought by
Gibson Allen J and Gibson Deborah F
Purchase Details
Closed on
Mar 8, 1974
Sold by
General Griffin Properties Inc
Bought by
Imes Ann B
Purchase Details
Closed on
Feb 28, 1974
Sold by
Smith J Larry
Bought by
General Griffin Properties Inc
Purchase Details
Closed on
Mar 31, 1970
Sold by
Goen Gayron L and Goen Diane M
Bought by
Smith J Larry
Purchase Details
Closed on
Apr 22, 1968
Sold by
Dutton Joe
Bought by
Goen Gayron L and Goen Diane M
Purchase Details
Closed on
Mar 3, 1966
Bought by
Dutton Joe
Create a Home Valuation Report for This Property
The Home Valuation Report is an in-depth analysis detailing your home's value as well as a comparison with similar homes in the area
Home Values in the Area
Average Home Value in this Area
Purchase History
| Date | Buyer | Sale Price | Title Company |
|---|---|---|---|
| Johnson Alvin D | $56,000 | -- | |
| Johnson Jerry D | -- | -- | |
| Admin Of Veterans Affairs | -- | -- | |
| Keen Jack A | $31,500 | -- | |
| Gibson Allen J | $28,000 | -- | |
| Imes Ann B | $1,000 | -- | |
| General Griffin Properties Inc | $13,500 | -- | |
| Smith J Larry | $6,200 | -- | |
| Goen Gayron L | $16,500 | -- | |
| Dutton Joe | -- | -- |
Source: Public Records
Tax History Compared to Growth
Tax History
| Year | Tax Paid | Tax Assessment Tax Assessment Total Assessment is a certain percentage of the fair market value that is determined by local assessors to be the total taxable value of land and additions on the property. | Land | Improvement |
|---|---|---|---|---|
| 2024 | $1,056 | $51,801 | $8,000 | $43,801 |
| 2023 | $1,056 | $49,944 | $8,000 | $41,944 |
| 2022 | $1,678 | $41,978 | $6,400 | $35,578 |
| 2021 | $832 | $33,249 | $6,400 | $26,849 |
| 2020 | $545 | $26,071 | $6,400 | $19,671 |
| 2019 | $554 | $26,071 | $6,400 | $19,671 |
| 2018 | $519 | $24,098 | $6,400 | $17,698 |
| 2017 | $444 | $21,886 | $6,400 | $15,486 |
| 2016 | $399 | $19,674 | $6,400 | $13,274 |
| 2015 | $407 | $19,674 | $6,400 | $13,274 |
| 2014 | $415 | $19,674 | $6,400 | $13,274 |
Source: Public Records
Map
Nearby Homes
- 1611 Piedmont Rd
- 1663 Piedmont Rd
- 450 Carver
- 1169 W Poplar St
- 203 Ashley Dr
- 1740 Summerwoods Ln
- 424 S Pine Hill Rd Unit 1
- 117 Mixon St
- TRACT A Newnan Rd
- 1723 Carrington Dr
- 1721 Carrington Dr
- 1707 Carrington Dr
- 1705 Carrington Dr
- 1326 Oakdale Dr
- 1850 Carrington Dr
- 711 S Pine Hill Rd
- 450 Carver Rd
- 733 S Pine Hill Rd
- 1610 Williamson Rd
- 1313 D F Fuller Dr
- 410 Leola Dr
- 414 Leola Dr
- 411 Leola Dr
- 408 Leola Dr
- 409 Leola Dr
- 413 Leola Dr
- 416 Leola Dr
- 407 Leola Dr
- 406 Leola Dr
- 415 Leola Dr
- 405 Leola Dr
- 418 Leola Dr
- 404 Leola Dr
- 417 Leola Dr
- 1630 Piedmont Rd
- 402 Leola Dr
- 0 Leola Dr Unit 8604173
- 0 Leola Dr Unit 7312636
- 0 Leola Dr Unit 7513019
- 0 Leola Dr Unit 7354324