412 Lyon Ct Unit Bldg-Unit South Lyon, MI 48178
Estimated Value: $318,238 - $340,000
3
Beds
2
Baths
1,444
Sq Ft
$226/Sq Ft
Est. Value
About This Home
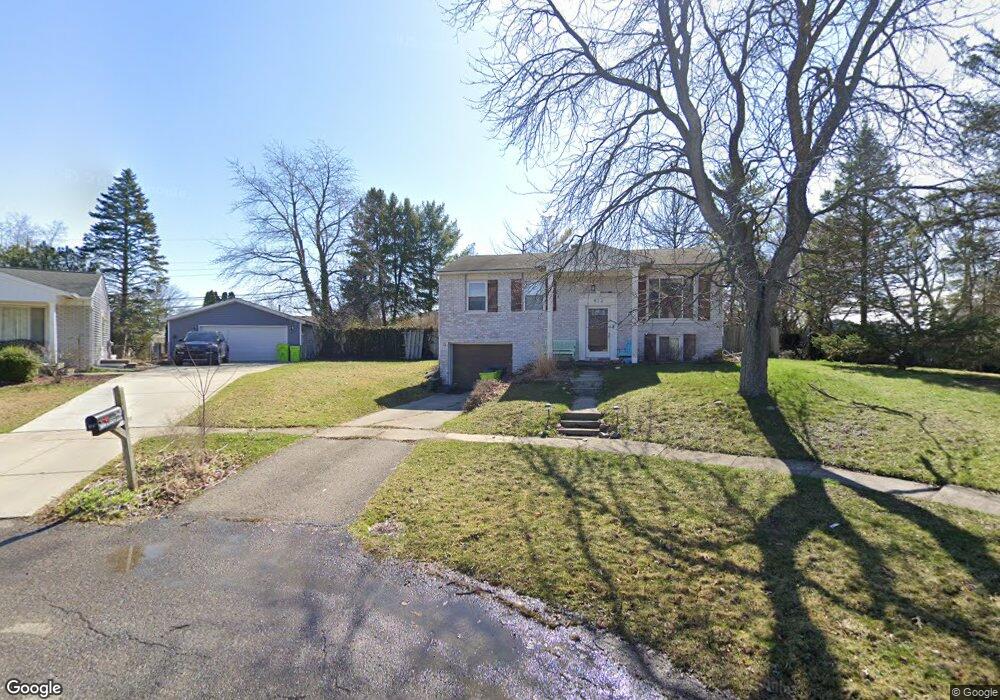
This home is located at 412 Lyon Ct Unit Bldg-Unit, South Lyon, MI 48178 and is currently estimated at $326,310, approximately $225 per square foot. 412 Lyon Ct Unit Bldg-Unit is a home located in Oakland County with nearby schools including Frank E. Bartlett School, Centennial Middle School, and South Lyon High School.
Ownership History
Date
Name
Owned For
Owner Type
Purchase Details
Closed on
Sep 14, 2017
Sold by
Roy Charles
Bought by
Murphy Melissa
Current Estimated Value
Home Financials for this Owner
Home Financials are based on the most recent Mortgage that was taken out on this home.
Original Mortgage
$216,161
Outstanding Balance
$180,120
Interest Rate
3.82%
Mortgage Type
New Conventional
Estimated Equity
$146,190
Purchase Details
Closed on
Nov 20, 2014
Sold by
Fannie Mae
Bought by
Roy Charles
Home Financials for this Owner
Home Financials are based on the most recent Mortgage that was taken out on this home.
Original Mortgage
$140,306
Interest Rate
3.97%
Mortgage Type
New Conventional
Purchase Details
Closed on
Oct 26, 2010
Sold by
Pierce Julie J
Bought by
Federal National Mortgage Association
Purchase Details
Closed on
Sep 21, 2007
Sold by
Oxner Bonnie M and Oxner Bonnie
Bought by
Pierce Julie J
Purchase Details
Closed on
Sep 20, 2000
Sold by
Oxner Sean
Bought by
Oxner Bonnie
Purchase Details
Closed on
Oct 1, 1996
Sold by
Gorman Timothy P
Bought by
Oxner Sean L
Home Financials for this Owner
Home Financials are based on the most recent Mortgage that was taken out on this home.
Original Mortgage
$120,041
Interest Rate
8.14%
Create a Home Valuation Report for This Property
The Home Valuation Report is an in-depth analysis detailing your home's value as well as a comparison with similar homes in the area
Home Values in the Area
Average Home Value in this Area
Purchase History
| Date | Buyer | Sale Price | Title Company |
|---|---|---|---|
| Murphy Melissa | $214,000 | None Available | |
| Roy Charles | -- | None Available | |
| Federal National Mortgage Association | $170,920 | None Available | |
| Pierce Julie J | $172,950 | None Available | |
| Oxner Bonnie | -- | -- | |
| Oxner Sean L | $121,000 | -- |
Source: Public Records
Mortgage History
| Date | Status | Borrower | Loan Amount |
|---|---|---|---|
| Open | Murphy Melissa | $216,161 | |
| Previous Owner | Roy Charles | $140,306 | |
| Previous Owner | Oxner Sean L | $120,041 |
Source: Public Records
Tax History Compared to Growth
Tax History
| Year | Tax Paid | Tax Assessment Tax Assessment Total Assessment is a certain percentage of the fair market value that is determined by local assessors to be the total taxable value of land and additions on the property. | Land | Improvement |
|---|---|---|---|---|
| 2024 | $4,195 | $142,480 | $0 | $0 |
| 2023 | $3,936 | $129,270 | $0 | $0 |
| 2022 | $3,810 | $111,340 | $0 | $0 |
| 2021 | $3,624 | $103,010 | $0 | $0 |
| 2020 | $3,508 | $99,740 | $0 | $0 |
| 2019 | $3,591 | $92,260 | $0 | $0 |
| 2018 | $3,500 | $85,930 | $0 | $0 |
| 2017 | $4,013 | $75,750 | $0 | $0 |
| 2016 | $3,978 | $73,670 | $0 | $0 |
| 2015 | -- | $66,180 | $0 | $0 |
| 2014 | -- | $60,200 | $0 | $0 |
| 2011 | -- | $54,510 | $0 | $0 |
Source: Public Records
Map
Nearby Homes
- 417 Lyon Ct
- 301 Winchester St
- 115 Wellington Dr
- 751 Norchester St
- 59550 10 Mile Rd
- 439 N Reese St
- 204 Maplewood Ct Unit 4
- 25100 Martindale Rd
- 404 Stryker St
- 951 N Mill St
- 61021 Heritage Blvd Unit 4
- 113 W Liberty St
- 61119 Heritage Blvd Unit 3
- 61117 Heritage Blvd
- 25159 Franklin Terrace Unit 8
- 777 Challenging Trail
- 25235 Franklin Terrace Unit 8
- 61001 Evergreen Ct
- 25124 Potomac Dr Unit 7
- 61019 Evergreen Ct Unit 22