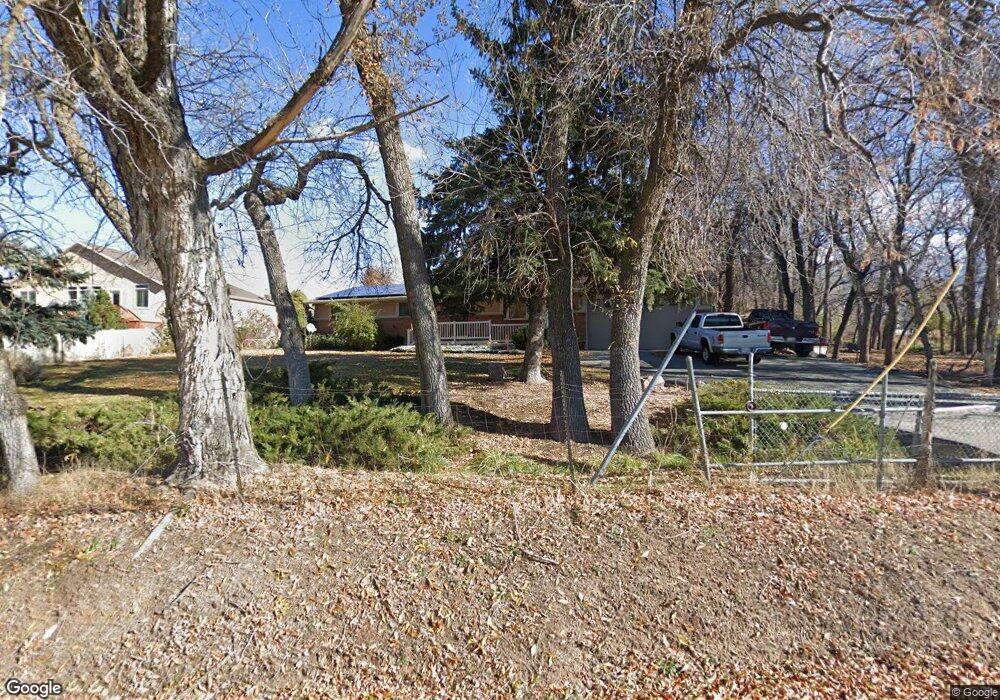
412 N Adamswood Rd Layton, UT 84040
Estimated Value: $466,000 - $511,000
3
Beds
2
Baths
2,536
Sq Ft
$196/Sq Ft
Est. Value
About This Home
This home is located at 412 N Adamswood Rd, Layton, UT 84040 and is currently estimated at $496,586, approximately $195 per square foot. 412 N Adamswood Rd is a home located in Davis County with nearby schools including Whitesides Elementary School, Central Davis Junior High School, and Layton High School.
Ownership History
Date
Name
Owned For
Owner Type
Purchase Details
Closed on
May 25, 2017
Sold by
Maynard Gary W
Bought by
Matthews Emily
Current Estimated Value
Home Financials for this Owner
Home Financials are based on the most recent Mortgage that was taken out on this home.
Original Mortgage
$123,000
Outstanding Balance
$102,093
Interest Rate
4.03%
Mortgage Type
New Conventional
Estimated Equity
$394,493
Purchase Details
Closed on
Mar 27, 2009
Sold by
Maynard Charlene A and Maynard Gary
Bought by
Maynard Charlene A and Maynard Gary W
Purchase Details
Closed on
Feb 21, 2002
Sold by
Maynard Charlene A
Bought by
Maynard Charlene A and Maynard Gary
Home Financials for this Owner
Home Financials are based on the most recent Mortgage that was taken out on this home.
Original Mortgage
$39,401
Interest Rate
7.04%
Create a Home Valuation Report for This Property
The Home Valuation Report is an in-depth analysis detailing your home's value as well as a comparison with similar homes in the area
Home Values in the Area
Average Home Value in this Area
Purchase History
| Date | Buyer | Sale Price | Title Company |
|---|---|---|---|
| Matthews Emily | -- | Hickman Land Title | |
| Maynard Charlene A | -- | None Available | |
| Maynard Charlene A | -- | Associated Title Company |
Source: Public Records
Mortgage History
| Date | Status | Borrower | Loan Amount |
|---|---|---|---|
| Open | Matthews Emily | $123,000 | |
| Previous Owner | Maynard Charlene A | $39,401 |
Source: Public Records
Tax History Compared to Growth
Tax History
| Year | Tax Paid | Tax Assessment Tax Assessment Total Assessment is a certain percentage of the fair market value that is determined by local assessors to be the total taxable value of land and additions on the property. | Land | Improvement |
|---|---|---|---|---|
| 2025 | $2,484 | $260,700 | $163,373 | $97,327 |
| 2024 | $2,367 | $250,250 | $179,114 | $71,136 |
| 2023 | $2,345 | $437,000 | $226,402 | $210,598 |
| 2022 | $2,364 | $239,250 | $122,734 | $116,516 |
| 2021 | $2,292 | $346,000 | $188,877 | $157,123 |
| 2020 | $1,968 | $285,000 | $161,502 | $123,498 |
| 2019 | $2,031 | $288,000 | $142,382 | $145,618 |
| 2018 | $1,910 | $272,000 | $117,784 | $154,216 |
| 2016 | $1,649 | $121,110 | $60,517 | $60,593 |
| 2015 | $1,613 | $112,475 | $60,517 | $51,958 |
| 2014 | $314 | $121,650 | $60,517 | $61,133 |
| 2013 | -- | $94,354 | $34,975 | $59,379 |
Source: Public Records
Map
Nearby Homes
- 431 N 1050 E
- 508 N Adamswood Rd
- 556 N Fairfield Rd Unit A2
- 556 N Fairfield Rd Unit D1
- 556 N Fairfield Rd Unit D2
- 556 N Fairfield Rd Unit A3
- 556 N Fairfield Rd Unit D3
- 556 N Fairfield Rd Unit D4
- 556 N Fairfield Rd Unit A1
- 556 N Fairfield Rd Unit A4
- 1247 E 300 N
- 861 E 575 N
- 857 E 575 N
- 479 N 1375 E
- 580 N Allanwood Place
- 942 E Gentile St
- 1503 E 530 N
- 654 Colonial St
- 1515 E Gentile St
- 794 Valeria Dr