Estimated Value: $234,240 - $253,000
3
Beds
3
Baths
1,740
Sq Ft
$140/Sq Ft
Est. Value
About This Home
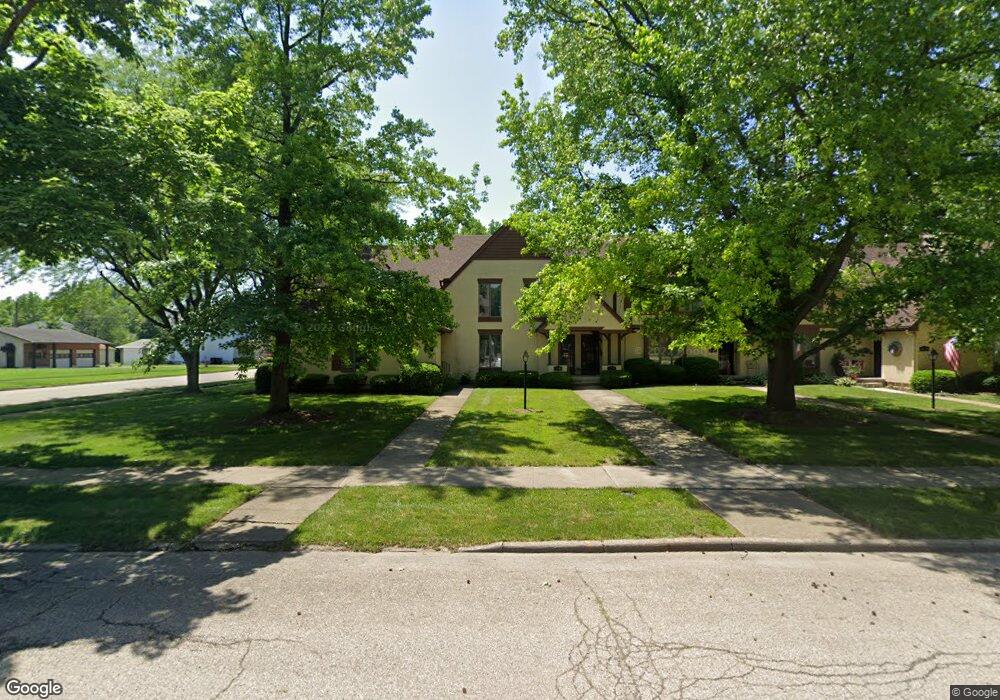
This home is located at 412 N King St, Xenia, OH 45385 and is currently estimated at $244,310, approximately $140 per square foot. 412 N King St is a home located in Greene County with nearby schools including Xenia High School, Summit Academy Community School for Alternative Learners - Xenia, and Legacy Christian Academy.
Ownership History
Date
Name
Owned For
Owner Type
Purchase Details
Closed on
Jun 27, 2000
Sold by
Gerard Anna L
Bought by
Upham Jordan A and Upham Donna J
Current Estimated Value
Purchase Details
Closed on
May 2, 1995
Sold by
Hidy David C
Bought by
Gerard Anna L
Home Financials for this Owner
Home Financials are based on the most recent Mortgage that was taken out on this home.
Original Mortgage
$114,700
Interest Rate
8.42%
Mortgage Type
New Conventional
Create a Home Valuation Report for This Property
The Home Valuation Report is an in-depth analysis detailing your home's value as well as a comparison with similar homes in the area
Home Values in the Area
Average Home Value in this Area
Purchase History
| Date | Buyer | Sale Price | Title Company |
|---|---|---|---|
| Upham Jordan A | $146,000 | -- | |
| Gerard Anna L | $143,450 | -- |
Source: Public Records
Mortgage History
| Date | Status | Borrower | Loan Amount |
|---|---|---|---|
| Previous Owner | Gerard Anna L | $114,700 |
Source: Public Records
Tax History Compared to Growth
Tax History
| Year | Tax Paid | Tax Assessment Tax Assessment Total Assessment is a certain percentage of the fair market value that is determined by local assessors to be the total taxable value of land and additions on the property. | Land | Improvement |
|---|---|---|---|---|
| 2024 | $2,368 | $63,900 | $7,000 | $56,900 |
| 2023 | $2,256 | $63,900 | $7,000 | $56,900 |
| 2022 | $2,187 | $53,460 | $7,000 | $46,460 |
| 2021 | $2,216 | $53,460 | $7,000 | $46,460 |
| 2020 | $1,086 | $53,460 | $7,000 | $46,460 |
| 2019 | $2,069 | $49,810 | $7,000 | $42,810 |
| 2018 | $2,077 | $49,810 | $7,000 | $42,810 |
| 2017 | $2,016 | $49,810 | $7,000 | $42,810 |
| 2016 | $2,020 | $47,950 | $7,000 | $40,950 |
| 2015 | $854 | $47,950 | $7,000 | $40,950 |
| 2014 | $62 | $47,950 | $7,000 | $40,950 |
Source: Public Records
Map
Nearby Homes