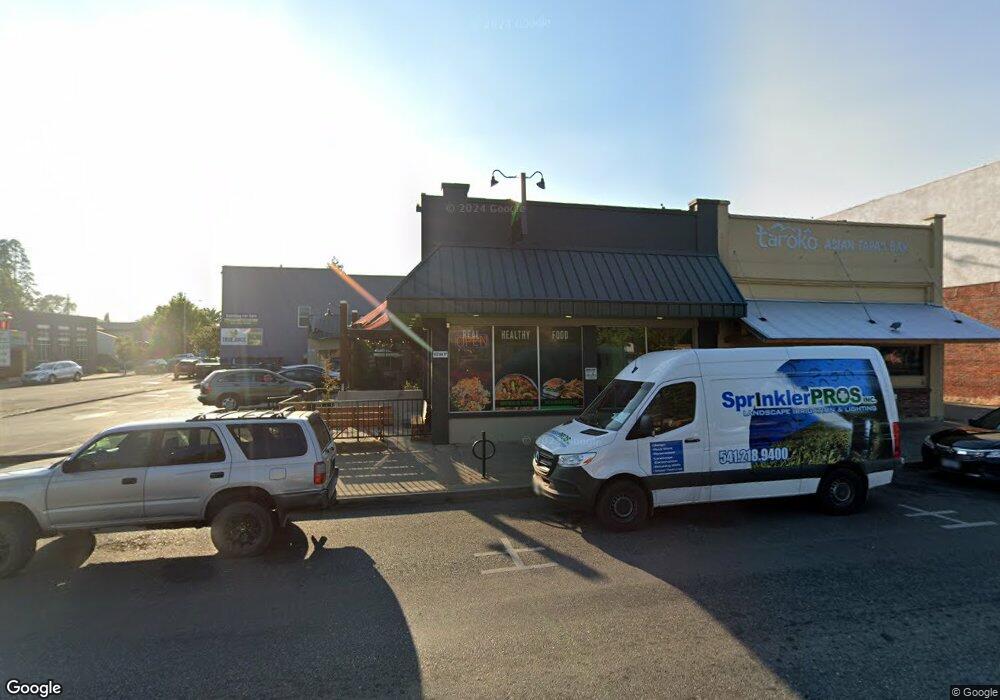
412 NW 6th St Grants Pass, OR 97526
Estimated Value: $775,913
--
Bed
2
Baths
2,898
Sq Ft
$268/Sq Ft
Est. Value
About This Home
This home is located at 412 NW 6th St, Grants Pass, OR 97526 and is currently estimated at $775,913, approximately $267 per square foot. 412 NW 6th St is a home located in Josephine County with nearby schools including Highland Elementary School, North Middle School, and Grants Pass High School.
Ownership History
Date
Name
Owned For
Owner Type
Purchase Details
Closed on
Nov 30, 2006
Sold by
Clason Nicholas A and Clason Karis M
Bought by
Pondelick Roy A and Pondelick Tana M
Current Estimated Value
Home Financials for this Owner
Home Financials are based on the most recent Mortgage that was taken out on this home.
Original Mortgage
$465,300
Interest Rate
6.37%
Mortgage Type
Commercial
Purchase Details
Closed on
Oct 26, 2006
Sold by
Dulong Paula L
Bought by
Clason Nicholas A
Home Financials for this Owner
Home Financials are based on the most recent Mortgage that was taken out on this home.
Original Mortgage
$465,300
Interest Rate
6.37%
Mortgage Type
Commercial
Create a Home Valuation Report for This Property
The Home Valuation Report is an in-depth analysis detailing your home's value as well as a comparison with similar homes in the area
Home Values in the Area
Average Home Value in this Area
Purchase History
| Date | Buyer | Sale Price | Title Company |
|---|---|---|---|
| Pondelick Roy A | $505,000 | First American Title Ins Co | |
| Clason Nicholas A | -- | None Available |
Source: Public Records
Mortgage History
| Date | Status | Borrower | Loan Amount |
|---|---|---|---|
| Closed | Pondelick Roy A | $465,300 |
Source: Public Records
Tax History Compared to Growth
Tax History
| Year | Tax Paid | Tax Assessment Tax Assessment Total Assessment is a certain percentage of the fair market value that is determined by local assessors to be the total taxable value of land and additions on the property. | Land | Improvement |
|---|---|---|---|---|
| 2025 | $3,916 | $301,530 | -- | -- |
| 2024 | $3,916 | $292,750 | -- | -- |
| 2023 | $3,688 | $284,230 | $0 | $0 |
| 2022 | $3,595 | $275,960 | $0 | $0 |
| 2021 | $3,481 | $267,930 | $0 | $0 |
| 2020 | $3,380 | $260,130 | $0 | $0 |
| 2019 | $3,282 | $252,560 | $0 | $0 |
| 2018 | $3,340 | $245,210 | $0 | $0 |
| 2017 | $3,315 | $238,070 | $0 | $0 |
| 2016 | $2,564 | $203,380 | $0 | $0 |
| 2015 | $2,481 | $197,460 | $0 | $0 |
| 2014 | $2,412 | $191,710 | $0 | $0 |
Source: Public Records
Map
Nearby Homes