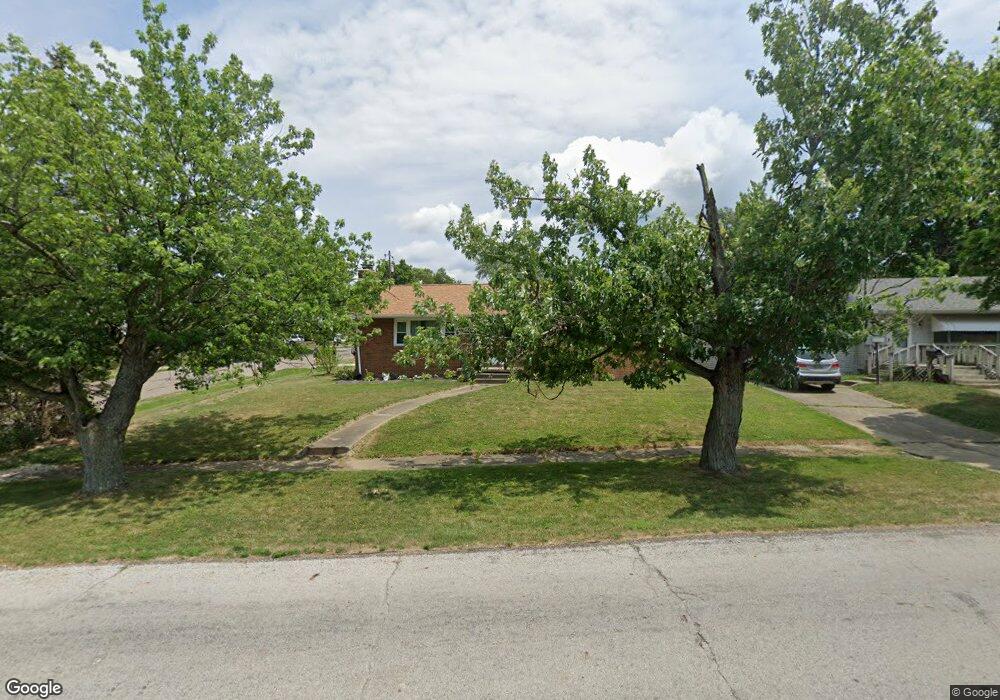
412 Parkway Blvd Alliance, OH 44601
Estimated Value: $105,000 - $158,799
3
Beds
1
Bath
1,125
Sq Ft
$120/Sq Ft
Est. Value
About This Home
This home is located at 412 Parkway Blvd, Alliance, OH 44601 and is currently estimated at $134,700, approximately $119 per square foot. 412 Parkway Blvd is a home located in Stark County with nearby schools including Alliance Early Learning School, Alliance Intermediate School at Northside, and Alliance Middle School.
Ownership History
Date
Name
Owned For
Owner Type
Purchase Details
Closed on
Mar 13, 2020
Sold by
Freconna Eugene
Bought by
Blume Zachary M
Current Estimated Value
Home Financials for this Owner
Home Financials are based on the most recent Mortgage that was taken out on this home.
Original Mortgage
$47,500
Outstanding Balance
$42,068
Interest Rate
3.5%
Mortgage Type
New Conventional
Estimated Equity
$92,632
Purchase Details
Closed on
Jan 9, 2017
Bought by
Eugene Freconna
Purchase Details
Closed on
Aug 19, 2009
Sold by
Estate Of Jean A Wible
Bought by
Freconna Nancy J
Purchase Details
Closed on
Aug 18, 2009
Sold by
Freconna Nancy J and Freconna Eugene
Bought by
Freconna Nancy J and Freconna Eugene
Purchase Details
Closed on
Sep 24, 2002
Sold by
Wible Carlos D
Bought by
Wible Jean A
Create a Home Valuation Report for This Property
The Home Valuation Report is an in-depth analysis detailing your home's value as well as a comparison with similar homes in the area
Home Values in the Area
Average Home Value in this Area
Purchase History
| Date | Buyer | Sale Price | Title Company |
|---|---|---|---|
| Blume Zachary M | $50,000 | Heritage Union Title Co Ltd | |
| Eugene Freconna | -- | -- | |
| Freconna Nancy J | -- | None Available | |
| Freconna Nancy J | -- | None Available | |
| Wible Jean A | -- | -- |
Source: Public Records
Mortgage History
| Date | Status | Borrower | Loan Amount |
|---|---|---|---|
| Open | Blume Zachary M | $47,500 |
Source: Public Records
Tax History Compared to Growth
Tax History
| Year | Tax Paid | Tax Assessment Tax Assessment Total Assessment is a certain percentage of the fair market value that is determined by local assessors to be the total taxable value of land and additions on the property. | Land | Improvement |
|---|---|---|---|---|
| 2025 | -- | $41,790 | $8,680 | $33,110 |
| 2024 | -- | $41,790 | $8,680 | $33,110 |
| 2023 | $1,248 | $31,050 | $6,440 | $24,610 |
| 2022 | $1,256 | $31,050 | $6,440 | $24,610 |
| 2021 | $1,257 | $31,050 | $6,440 | $24,610 |
| 2020 | $1,151 | $25,870 | $5,600 | $20,270 |
| 2019 | $1,135 | $25,870 | $5,600 | $20,270 |
| 2018 | $1,140 | $25,870 | $5,600 | $20,270 |
| 2017 | $1,111 | $24,750 | $5,740 | $19,010 |
| 2016 | $1,254 | $25,800 | $5,740 | $20,060 |
| 2015 | $1,178 | $25,800 | $5,740 | $20,060 |
| 2014 | $1,208 | $25,200 | $5,600 | $19,600 |
| 2013 | $603 | $25,200 | $5,600 | $19,600 |
Source: Public Records
Map
Nearby Homes
- 565 W Broadway St
- 725 W Summit St
- 645 W Summit St
- 734 Parkway Blvd
- 345 W Market St
- 329 1/2 W Main St
- 896 Parkway Blvd
- 132 S Haines Ave
- 163 W Market St
- 511 W Ely St
- 738 Kingsway St
- 140 W Summit St
- 970 Kingsway St
- 427 S Union Ave
- 1038 Fairview Place
- 807 S Union Ave
- 432 Johnson Ave
- 1321 Parkway Blvd
- 1201 Overlook Dr
- 505 N Union Ave
- 424 Parkway Blvd
- 548 W High St
- 346 Parkway Blvd
- 569 W Oxford St
- 526 W High St
- 549 W High St
- 545 W Oxford St
- 334 Parkway Blvd
- 535 W Oxford St
- 525 W Oxford St
- 324 Parkway Blvd
- 407 S Rockhill Ave
- 421 S Rockhill Ave
- 560 W Broadway St
- 345 S Rockhill Ave
- 517 W Oxford St
- 540 W Broadway St
- 325 Parkway Blvd
- 333 S Rockhill Ave
- 304 Parkway Blvd