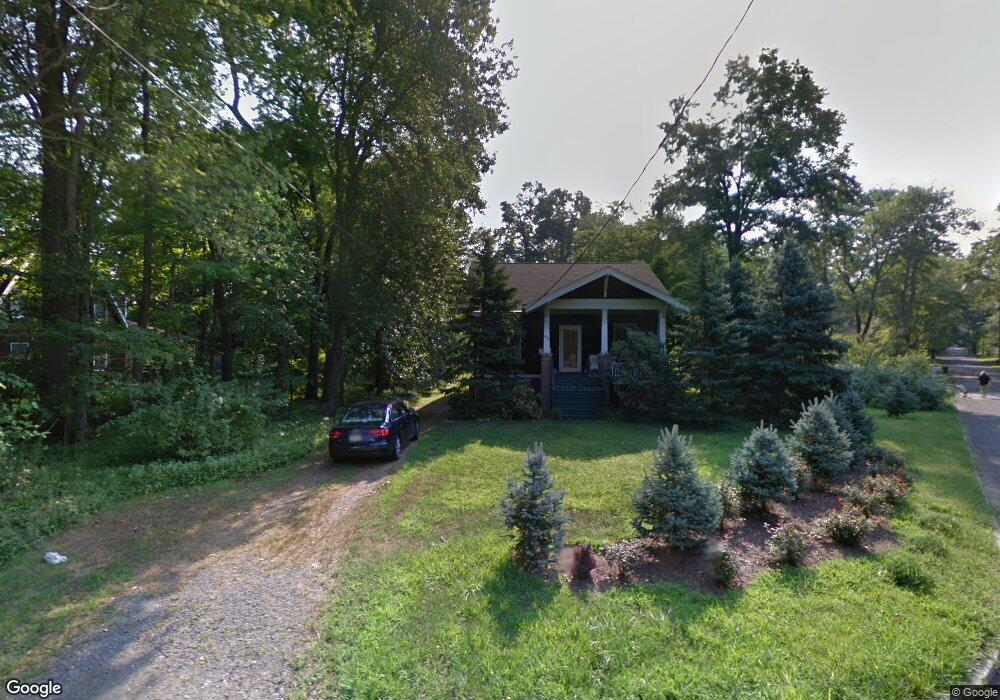
412 Piermont Rd Demarest, NJ 07627
Estimated Value: $852,000 - $1,277,000
3
Beds
2
Baths
2,286
Sq Ft
$474/Sq Ft
Est. Value
About This Home
This home is located at 412 Piermont Rd, Demarest, NJ 07627 and is currently estimated at $1,082,760, approximately $473 per square foot. 412 Piermont Rd is a home located in Bergen County with nearby schools including County Road Elementary School, Demarest Middle School, and Luther Lee Emerson Elementary School.
Ownership History
Date
Name
Owned For
Owner Type
Purchase Details
Closed on
Dec 9, 2020
Sold by
Ando Seiichiro and Kim Haengmi
Bought by
Ando Seiichiro
Current Estimated Value
Purchase Details
Closed on
Dec 19, 2019
Sold by
Pienkawa Kaz and Swiatek Danuta
Bought by
Ando Seiichiro
Home Financials for this Owner
Home Financials are based on the most recent Mortgage that was taken out on this home.
Original Mortgage
$395,250
Interest Rate
3.6%
Mortgage Type
New Conventional
Purchase Details
Closed on
Jan 2, 2018
Sold by
Ionescu Jenny
Bought by
Pienkawa Kaz and Swiatek Danuta
Home Financials for this Owner
Home Financials are based on the most recent Mortgage that was taken out on this home.
Original Mortgage
$453,100
Interest Rate
3.94%
Mortgage Type
Purchase Money Mortgage
Create a Home Valuation Report for This Property
The Home Valuation Report is an in-depth analysis detailing your home's value as well as a comparison with similar homes in the area
Home Values in the Area
Average Home Value in this Area
Purchase History
| Date | Buyer | Sale Price | Title Company |
|---|---|---|---|
| Ando Seiichiro | -- | Westcor Land Title Ins Co | |
| Ando Seiichiro | $465,000 | Westcor Land Title Ins Co | |
| Pienkawa Kaz | $525,000 | -- |
Source: Public Records
Mortgage History
| Date | Status | Borrower | Loan Amount |
|---|---|---|---|
| Previous Owner | Ando Seiichiro | $395,250 | |
| Previous Owner | Pienkawa Kaz | $453,100 |
Source: Public Records
Tax History
| Year | Tax Paid | Tax Assessment Tax Assessment Total Assessment is a certain percentage of the fair market value that is determined by local assessors to be the total taxable value of land and additions on the property. | Land | Improvement |
|---|---|---|---|---|
| 2025 | $10,553 | $1,005,300 | $582,300 | $423,000 |
| 2024 | $10,073 | $345,200 | $250,300 | $94,900 |
| 2023 | $9,800 | $345,200 | $250,300 | $94,900 |
| 2022 | $9,800 | $345,200 | $250,300 | $94,900 |
| 2021 | $9,559 | $345,200 | $250,300 | $94,900 |
| 2020 | $9,334 | $345,200 | $250,300 | $94,900 |
| 2019 | $8,949 | $340,800 | $250,300 | $90,500 |
| 2018 | $8,673 | $340,800 | $250,300 | $90,500 |
| 2017 | $8,465 | $340,800 | $250,300 | $90,500 |
| 2016 | $8,333 | $340,800 | $250,300 | $90,500 |
| 2015 | $8,220 | $340,800 | $250,300 | $90,500 |
| 2014 | $8,043 | $340,800 | $250,300 | $90,500 |
Source: Public Records
Map
Nearby Homes
Your Personal Tour Guide
Ask me questions while you tour the home.