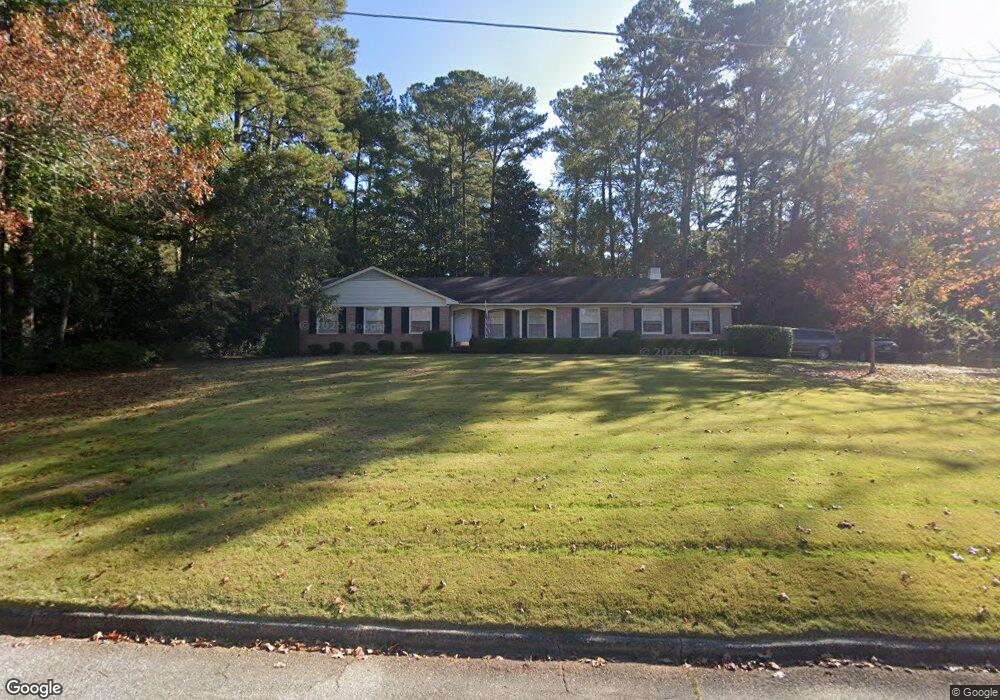
412 Pineview Terrace Lagrange, GA 30240
Estimated Value: $323,255 - $363,000
4
Beds
2
Baths
2,484
Sq Ft
$140/Sq Ft
Est. Value
About This Home
This home is located at 412 Pineview Terrace, Lagrange, GA 30240 and is currently estimated at $346,564, approximately $139 per square foot. 412 Pineview Terrace is a home located in Troup County with nearby schools including Hollis Hand Elementary School, Ethel W. Kight Elementary School, and Franklin Forest Elementary School.
Ownership History
Date
Name
Owned For
Owner Type
Purchase Details
Closed on
Feb 6, 2024
Sold by
Johnson Woodward Ann
Bought by
Woodward Harold D
Current Estimated Value
Purchase Details
Closed on
May 25, 1999
Sold by
Elizabeth Hodge By Laura Shedd
Bought by
Woodward Harold D and Woodward Ann J
Purchase Details
Closed on
Nov 6, 1992
Sold by
Hatcher Charles R and Hatcher Jane H
Bought by
Elizabeth Hodge By Laura Shedd
Purchase Details
Closed on
Oct 1, 1982
Sold by
Norman Norman S and Norman Carolyn M
Bought by
Hatcher Charles R and Hatcher Jane H
Purchase Details
Closed on
Aug 14, 1979
Sold by
Thompson Dean C and Thompson Shirley A
Bought by
Norman Norman S and Norman Carolyn M
Purchase Details
Closed on
Aug 5, 1977
Sold by
James A Yarbrough
Bought by
Thompson Dean C and Thompson Shirley A
Purchase Details
Closed on
Jan 1, 1969
Sold by
Wilbur J Whatley
Bought by
James A Yarbrough
Create a Home Valuation Report for This Property
The Home Valuation Report is an in-depth analysis detailing your home's value as well as a comparison with similar homes in the area
Purchase History
| Date | Buyer | Sale Price | Title Company |
|---|---|---|---|
| Woodward Harold D | -- | -- | |
| Woodward Harold D | $125,000 | -- | |
| Elizabeth Hodge By Laura Shedd | $84,500 | -- | |
| Hatcher Charles R | $76,500 | -- | |
| Norman Norman S | $66,000 | -- | |
| Thompson Dean C | $57,500 | -- | |
| James A Yarbrough | $34,800 | -- |
Source: Public Records
Tax History
| Year | Tax Paid | Tax Assessment Tax Assessment Total Assessment is a certain percentage of the fair market value that is determined by local assessors to be the total taxable value of land and additions on the property. | Land | Improvement |
|---|---|---|---|---|
| 2025 | $3,144 | $126,400 | $18,000 | $108,400 |
| 2024 | $2,693 | $100,720 | $18,000 | $82,720 |
| 2023 | $2,058 | $95,360 | $18,000 | $77,360 |
| 2022 | $2,403 | $88,080 | $18,000 | $70,080 |
| 2021 | $2,373 | $80,680 | $18,000 | $62,680 |
| 2020 | $2,373 | $80,680 | $18,000 | $62,680 |
| 2019 | $1,966 | $67,160 | $12,320 | $54,840 |
| 2018 | $1,887 | $64,560 | $12,320 | $52,240 |
| 2017 | $1,495 | $51,564 | $12,244 | $39,320 |
| 2016 | $1,494 | $51,528 | $12,244 | $39,284 |
| 2015 | $1,497 | $51,528 | $12,244 | $39,284 |
| 2014 | $1,132 | $39,372 | $12,244 | $27,128 |
| 2013 | -- | $42,780 | $12,244 | $30,536 |
Source: Public Records
Map
Nearby Homes
- 705 Piney Woods Dr
- 216 E Lane Cir
- 203 Waverly Way
- 598 Edmondson Ave
- 120 Saynor Cir
- 105 Saynor Cir
- 910 Piney Woods Dr
- 0 Hills and Dales Farm Rd
- 119 College Ave
- 0 N Lee St Unit 10550825
- 217 Jefferson St
- 222 Beechwood Cir
- 208 Boulevard
- 206 Broad St
- 304 Boulevard
- 421 College Ave
- 416 Park Ave
- 405 W Broome St Unit 2
- 405 W Broome St Unit 3
- 405 W Broome St Unit 4
- 418 Pineview Terrace
- 405 Ridgecrest Rd
- 411 Pineview Terrace
- 100 Loyd Place
- 411 Ridgecrest Rd
- 415 Pineview Terrace
- 200 Ridgecrest Rd
- 403 Ridgecrest Rd
- 424 Pineview Terrace
- 419 Pineview Terrace
- 206 Ridgecrest Rd
- 417 Ridgecrest Rd
- 426 Pineview Terrace
- 410 Ridgecrest Rd
- 210 Ridgecrest Rd
- 401 Ridgecrest Rd
- 408 Ridgecrest Rd
- 201 Ridgecrest Rd
- 210 Westwood Dr
- 427 Pineview Terrace
Your Personal Tour Guide
Ask me questions while you tour the home.