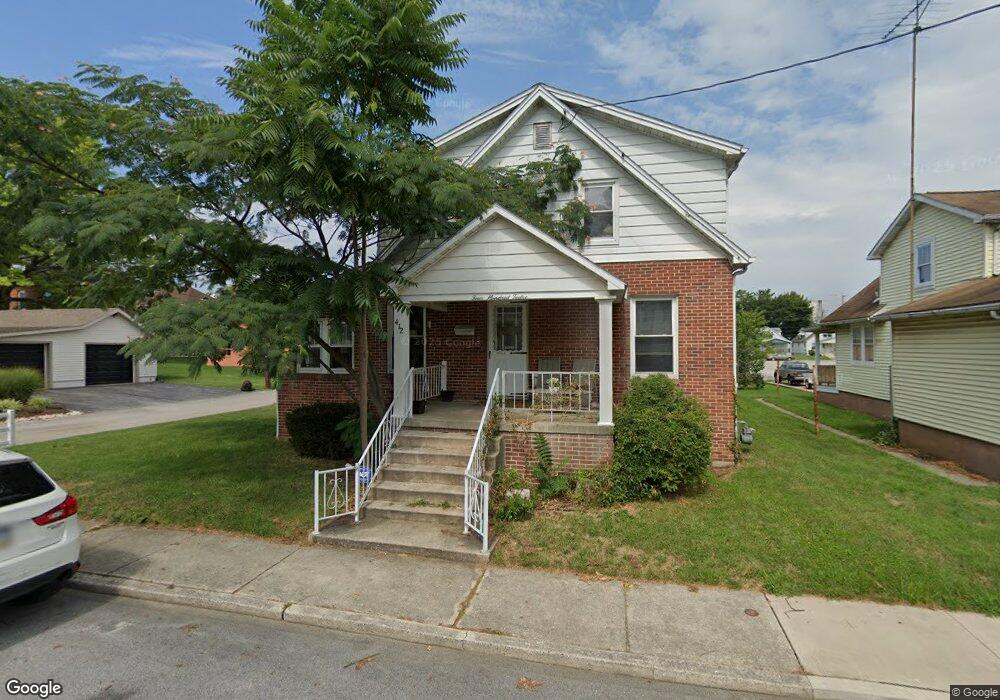
412 Pleasant St Hanover, PA 17331
Hanover Historic District NeighborhoodEstimated Value: $233,524 - $252,000
About This Home
Located just five miles north of the Mason-Dixon Line, Hanover is a York County borough brimming with historic charm. Incorporated in 1815, Hanover contains a bevy of beautifully preserved homes with rustic appeal in addition to numerous historical sites such as the Warehime-Myers Mansion and the Neas House.
A walkable downtown also contributes to Hanover’s vintage appeal, featuring rows of specialty shops, local restaurants, and various small businesses in well-preserved buildings. Additional shopping opportunities abound along Route 94, Eisenhower Drive, and throughout North Hanover Mall as well.
Hanover residents enjoy the area’s small-town feel as well as short driving distance to larger cities like Baltimore and Washington, DC. Codorus State Park also sits within close proximity to Hanover, offering plenty of options for outdoor recreation.
Ownership History
Purchase Details
Purchase Details
Home Values in the Area
Average Home Value in this Area
Purchase History
| Date | Buyer | Sale Price | Title Company |
|---|---|---|---|
| Lee Christine A | -- | None Available | |
| Snyder Kenneth M | -- | -- |
Property History
| Date | Event | Price | List to Sale | Price per Sq Ft |
|---|---|---|---|---|
| 02/12/2025 02/12/25 | Off Market | $2,000 | -- | -- |
| 02/10/2025 02/10/25 | Off Market | -- | -- | -- |
| 01/10/2025 01/10/25 | For Rent | $2,000 | 0.0% | -- |
| 01/10/2025 01/10/25 | For Rent | -- | -- | -- |
| 11/18/2024 11/18/24 | Off Market | $2,000 | -- | -- |
| 10/14/2024 10/14/24 | For Rent | $2,000 | -- | -- |
Tax History
| Year | Tax Paid | Tax Assessment Tax Assessment Total Assessment is a certain percentage of the fair market value that is determined by local assessors to be the total taxable value of land and additions on the property. | Land | Improvement |
|---|---|---|---|---|
| 2025 | $4,193 | $114,520 | $23,810 | $90,710 |
| 2024 | $4,161 | $114,520 | $23,810 | $90,710 |
| 2023 | $4,128 | $114,520 | $23,810 | $90,710 |
| 2022 | $4,078 | $114,520 | $23,810 | $90,710 |
| 2021 | $3,964 | $114,520 | $23,810 | $90,710 |
| 2020 | $3,964 | $114,520 | $23,810 | $90,710 |
| 2019 | $3,902 | $114,520 | $23,810 | $90,710 |
| 2018 | $3,830 | $114,520 | $23,810 | $90,710 |
| 2017 | $3,757 | $114,520 | $23,810 | $90,710 |
| 2016 | $0 | $114,520 | $23,810 | $90,710 |
| 2015 | -- | $114,520 | $23,810 | $90,710 |
| 2014 | -- | $114,520 | $23,810 | $90,710 |
Map
- 414 Pleasant St
- 416 Pleasant St
- 410 Fulton St
- 414 Fulton St
- 418 Pleasant St
- 407 Pleasant St
- 405 Pleasant St
- 408 Fulton St
- 420 Pleasant St
- 406 Fulton St
- 411 Pleasant St
- 500 Fulton St
- 417 Pleasant St Unit 4
- 417 Pleasant St
- 419 Pleasant St
- 404 Fulton St
- 504 Fulton St
- 424 Pleasant St
- 421 Pleasant St
- 423 Pleasant St
Ask me questions while you tour the home.