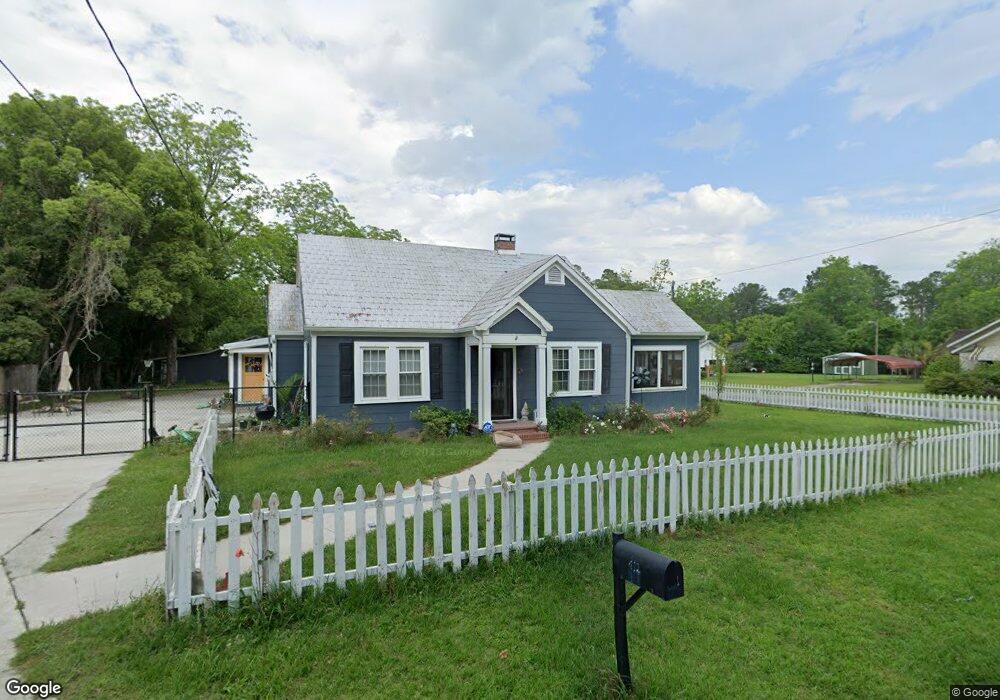
412 S Berrien St Nashville, GA 31639
Estimated Value: $121,551 - $162,000
2
Beds
2
Baths
1,786
Sq Ft
$81/Sq Ft
Est. Value
About This Home
This home is located at 412 S Berrien St, Nashville, GA 31639 and is currently estimated at $143,888, approximately $80 per square foot. 412 S Berrien St is a home located in Berrien County with nearby schools including Berrien Primary School, Berrien Elementary School, and Berrien Middle School.
Ownership History
Date
Name
Owned For
Owner Type
Purchase Details
Closed on
Feb 10, 2017
Sold by
Dolle Kenneth W
Bought by
Watford James Edward
Current Estimated Value
Home Financials for this Owner
Home Financials are based on the most recent Mortgage that was taken out on this home.
Original Mortgage
$72,117
Interest Rate
4.12%
Mortgage Type
New Conventional
Purchase Details
Closed on
Aug 31, 2006
Sold by
Johnson Melvin H
Bought by
Dolle Kenneth W
Purchase Details
Closed on
Mar 28, 2006
Sold by
Cb Hfn Bank One
Bought by
Johnson Melvin H
Purchase Details
Closed on
Apr 5, 2005
Sold by
Thomas James Roberson
Bought by
Bank One National Association
Purchase Details
Closed on
May 12, 2000
Sold by
Watson Wayne
Bought by
Thomas James and Thomas Bren
Purchase Details
Closed on
Dec 29, 1999
Sold by
Pittman Perry H and Pittman G
Bought by
Watson Wayne
Purchase Details
Closed on
Aug 2, 1994
Sold by
Pittman Perry H and Pittman G
Bought by
Pittman Perry H and Pittman G
Purchase Details
Closed on
Mar 24, 1980
Bought by
Pittman Perry H and Pittman G
Create a Home Valuation Report for This Property
The Home Valuation Report is an in-depth analysis detailing your home's value as well as a comparison with similar homes in the area
Home Values in the Area
Average Home Value in this Area
Purchase History
| Date | Buyer | Sale Price | Title Company |
|---|---|---|---|
| Watford James Edward | $50,000 | -- | |
| Dolle Kenneth W | $69,900 | -- | |
| Johnson Melvin H | $45,000 | -- | |
| Bank One National Association | $48,000 | -- | |
| Thomas James | $64,000 | -- | |
| Watson Wayne | $32,500 | -- | |
| Pittman Perry H | -- | -- | |
| Pittman Perry H | $32,000 | -- |
Source: Public Records
Mortgage History
| Date | Status | Borrower | Loan Amount |
|---|---|---|---|
| Closed | Watford James Edward | $72,117 |
Source: Public Records
Tax History Compared to Growth
Tax History
| Year | Tax Paid | Tax Assessment Tax Assessment Total Assessment is a certain percentage of the fair market value that is determined by local assessors to be the total taxable value of land and additions on the property. | Land | Improvement |
|---|---|---|---|---|
| 2024 | $911 | $22,337 | $2,368 | $19,969 |
| 2023 | $915 | $22,337 | $2,368 | $19,969 |
| 2022 | $915 | $22,337 | $2,368 | $19,969 |
| 2021 | $707 | $22,337 | $2,368 | $19,969 |
| 2020 | $708 | $22,337 | $2,368 | $19,969 |
| 2019 | $708 | $22,337 | $2,368 | $19,969 |
| 2018 | $867 | $22,337 | $2,368 | $19,969 |
| 2017 | $779 | $24,553 | $2,368 | $22,185 |
| 2016 | $756 | $24,553 | $2,368 | $22,185 |
| 2015 | -- | $24,553 | $2,368 | $22,185 |
| 2014 | -- | $24,553 | $2,368 | $22,185 |
| 2013 | -- | $24,385 | $2,200 | $22,185 |
Source: Public Records
Map
Nearby Homes
- 409 Abby St
- 602 S Berrien St
- 205 S Dogwood Dr Unit K
- 309 S Dogwood Dr
- 307 Gaskins St
- 514 W Mcpherson Ave
- 612 W Dennis Ave
- 805 S Berrien St
- 213 Chism Ave
- .73AC Davis St
- 713 Pall Mall Place
- 624 W Washington Ave
- 102 W Avera Ave
- 301 Kirby Cir
- 203 Guest Cir
- 208 N Bullard St Unit A/ B
- 201 Beetree Ave
- 205 Beetree Ave
- 501 E 7th Ave
- 603 N Jackson St
- 404 S Berrien St
- 409 S Berrien St
- 306 Gary Ave
- 407 S Berrien St
- 308 Gary Ave
- 405 S Berrien St
- 402 S Berrien St
- 614 Howard St
- 411 Abbey Place
- 616 Howard St
- 304 Gary Ave
- 409 Abbey Place
- 403 S Berrien St
- 509 College St
- 405 Gary Ave
- 304 W Dennis Ave
- 400 S Berrien St
- 506 S Berrien St
- 618 Howard St
- 513 College St