Estimated Value: $98,934
--
Bed
--
Bath
--
Sq Ft
6,098
Sq Ft Lot
About This Home
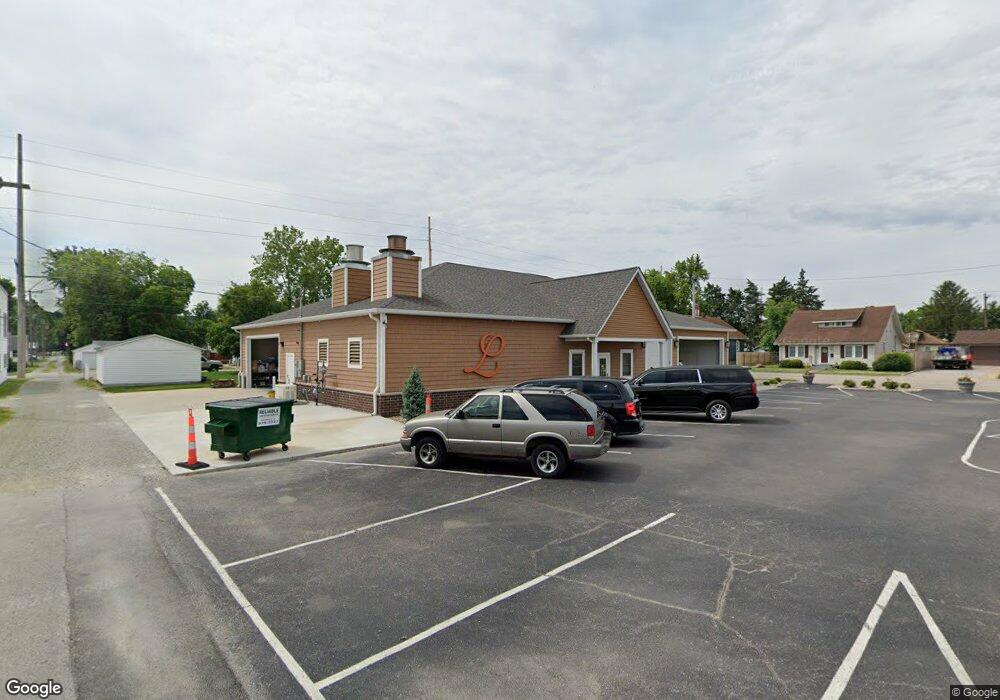
This home is located at 412 S Main St, Dupo, IL 62239 and is currently estimated at $98,934. 412 S Main St is a home located in St. Clair County with nearby schools including Bluffview Elementary School and Dupo High School.
Ownership History
Date
Name
Owned For
Owner Type
Purchase Details
Closed on
Jan 31, 2017
Sold by
Leesman Bruce and Leesman Bruce E
Bought by
Leesman Real Estate Llc
Current Estimated Value
Home Financials for this Owner
Home Financials are based on the most recent Mortgage that was taken out on this home.
Original Mortgage
$577,000
Outstanding Balance
$313,203
Interest Rate
4.16%
Mortgage Type
New Conventional
Estimated Equity
-$214,269
Purchase Details
Closed on
Mar 9, 2011
Sold by
Estate Of William S Spier
Bought by
Leesman Bruce
Home Financials for this Owner
Home Financials are based on the most recent Mortgage that was taken out on this home.
Original Mortgage
$50,000
Interest Rate
5.09%
Mortgage Type
Future Advance Clause Open End Mortgage
Create a Home Valuation Report for This Property
The Home Valuation Report is an in-depth analysis detailing your home's value as well as a comparison with similar homes in the area
Home Values in the Area
Average Home Value in this Area
Purchase History
| Date | Buyer | Sale Price | Title Company |
|---|---|---|---|
| Leesman Real Estate Llc | -- | Attorney | |
| Leesman Bruce | $50,000 | Accent Title Inc |
Source: Public Records
Mortgage History
| Date | Status | Borrower | Loan Amount |
|---|---|---|---|
| Open | Leesman Real Estate Llc | $577,000 | |
| Closed | Leesman Bruce | $50,000 |
Source: Public Records
Tax History Compared to Growth
Tax History
| Year | Tax Paid | Tax Assessment Tax Assessment Total Assessment is a certain percentage of the fair market value that is determined by local assessors to be the total taxable value of land and additions on the property. | Land | Improvement |
|---|---|---|---|---|
| 2024 | $625 | $7,193 | $3,734 | $3,459 |
| 2023 | $648 | $6,684 | $3,470 | $3,214 |
| 2022 | $580 | $6,270 | $3,255 | $3,015 |
| 2021 | $563 | $5,900 | $3,063 | $2,837 |
| 2020 | $549 | $5,402 | $2,805 | $2,597 |
| 2019 | $519 | $5,402 | $2,805 | $2,597 |
| 2018 | $497 | $5,154 | $2,676 | $2,478 |
| 2017 | $364 | $4,789 | $2,486 | $2,303 |
| 2016 | $250 | $2,403 | $2,403 | $0 |
| 2014 | $233 | $2,403 | $2,403 | $0 |
| 2013 | $1,667 | $2,459 | $2,459 | $0 |
Source: Public Records
Map
Nearby Homes