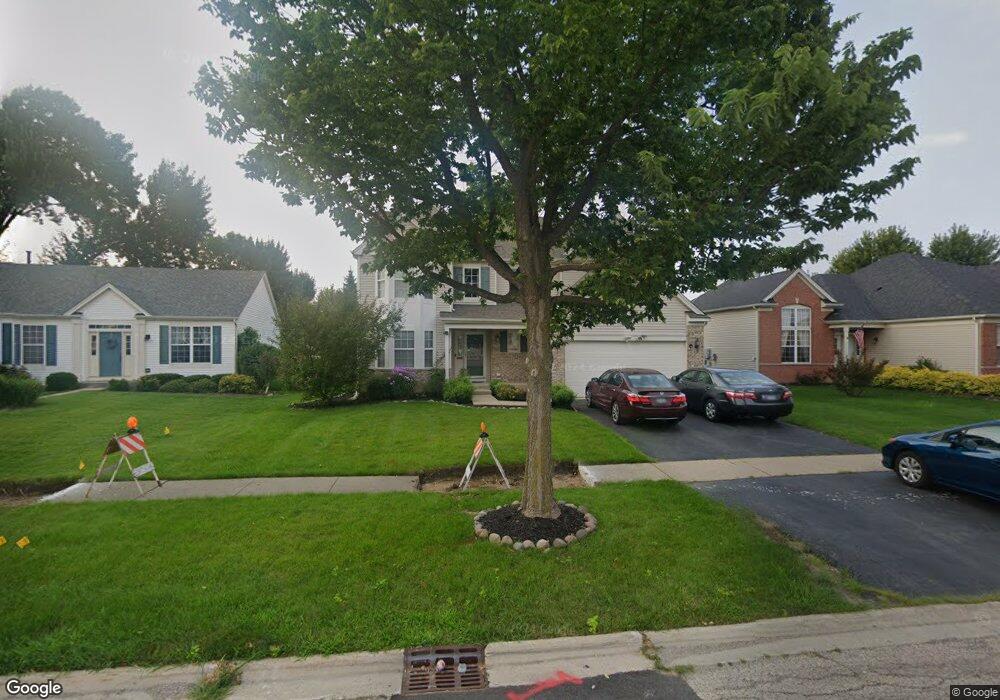
412 W Meadow Mist Ln Round Lake, IL 60073
Estimated Value: $454,159 - $473,000
4
Beds
3
Baths
3,066
Sq Ft
$151/Sq Ft
Est. Value
About This Home
This home is located at 412 W Meadow Mist Ln, Round Lake, IL 60073 and is currently estimated at $464,040, approximately $151 per square foot. 412 W Meadow Mist Ln is a home located in Lake County with nearby schools including Park Campus, Frederick School, and Grayslake Middle School.
Ownership History
Date
Name
Owned For
Owner Type
Purchase Details
Closed on
Sep 23, 2010
Sold by
Stringer Charles C and Stringer Monica L
Bought by
Patel Ankit P and Patel Meha A
Current Estimated Value
Home Financials for this Owner
Home Financials are based on the most recent Mortgage that was taken out on this home.
Original Mortgage
$174,400
Interest Rate
4.42%
Mortgage Type
New Conventional
Purchase Details
Closed on
Mar 8, 2007
Sold by
Andre John G and Knipstein Amy K
Bought by
Stringer Charles C and Stringer Monica L
Home Financials for this Owner
Home Financials are based on the most recent Mortgage that was taken out on this home.
Original Mortgage
$252,000
Interest Rate
6.4%
Mortgage Type
Unknown
Purchase Details
Closed on
Jan 30, 2003
Sold by
Neumann Homes Inc
Bought by
Andre John G and Andre Amy K
Home Financials for this Owner
Home Financials are based on the most recent Mortgage that was taken out on this home.
Original Mortgage
$210,000
Interest Rate
5.71%
Create a Home Valuation Report for This Property
The Home Valuation Report is an in-depth analysis detailing your home's value as well as a comparison with similar homes in the area
Home Values in the Area
Average Home Value in this Area
Purchase History
| Date | Buyer | Sale Price | Title Company |
|---|---|---|---|
| Patel Ankit P | $218,000 | None Available | |
| Stringer Charles C | $315,000 | Multiple | |
| Andre John G | $287,500 | -- |
Source: Public Records
Mortgage History
| Date | Status | Borrower | Loan Amount |
|---|---|---|---|
| Closed | Patel Ankit P | $174,400 | |
| Previous Owner | Stringer Charles C | $252,000 | |
| Previous Owner | Andre John G | $210,000 |
Source: Public Records
Tax History Compared to Growth
Tax History
| Year | Tax Paid | Tax Assessment Tax Assessment Total Assessment is a certain percentage of the fair market value that is determined by local assessors to be the total taxable value of land and additions on the property. | Land | Improvement |
|---|---|---|---|---|
| 2024 | $12,546 | $117,774 | $19,689 | $98,085 |
| 2023 | $10,959 | $107,911 | $18,040 | $89,871 |
| 2022 | $10,959 | $91,451 | $18,486 | $72,965 |
| 2021 | $10,891 | $88,247 | $17,838 | $70,409 |
| 2020 | $11,129 | $85,818 | $17,347 | $68,471 |
| 2019 | $10,865 | $82,997 | $16,777 | $66,220 |
| 2018 | $5,330 | $79,241 | $16,009 | $63,232 |
| 2017 | $10,655 | $76,747 | $15,505 | $61,242 |
| 2016 | $10,577 | $72,891 | $14,726 | $58,165 |
| 2015 | $10,581 | $68,333 | $13,805 | $54,528 |
| 2014 | $10,232 | $68,085 | $13,475 | $54,610 |
| 2012 | $9,398 | $68,690 | $13,595 | $55,095 |
Source: Public Records
Map
Nearby Homes
- 438 W Meadow Mist Ln
- 479 W Butterfield Ln
- 345 W Asbury Dr
- 178 W Hampton Dr
- 1354 S Abington Ln Unit 1
- 407 W Waterbury Dr
- 801 S Parkside Dr Unit 4
- 714 S Rosehall Ln Unit 3
- 1476 S Wild Meadow Rd
- 73 W Providence Ln Unit 5
- 389 W Caldwell Dr
- 602 S Rosehall Ln
- 626 S Curran Rd
- 659 S Rosehall Ln
- 472 W Savoy Dr
- 22731 W Townline Rd
- 593 W Hamlin Ln Unit 1
- 0 S Cedar Lake Rd Unit MRD12365608
- 124 W Buckingham Dr Unit 134
- 1823 S Fallbrook Dr
- 400 W Meadow Mist Ln
- 422 W Meadow Mist Ln
- 388 W Meadow Mist Ln
- 430 W Meadow Mist Ln
- 409 W Meadow Mist Ln
- 425 W Meadow Mist Ln
- 378 W Meadow Mist Ln
- 393 W Meadow Mist Ln
- 437 W Meadow Mist Ln
- 366 W Highplains Rd
- 404 W Highplains Rd
- 450 W Meadow Mist Ln
- 412 W Highplains Rd
- 443 W Meadow Mist Ln
- 356 W Highplains Rd
- 466 W Meadow Mist Ln
- 367 W Highplains Rd
- 377 W Highplains Rd
- 383 W Highplains Rd
- 418 W Highplains Rd